
KEY FINDINGS_
- 88.29%, or 181 of the 205 TV reviewers we analyzed earned a failing Trust Rating under 60%, meaning they don’t test TVs and
- 98 of the 205 TV reviewers (47.80%) publish fake reviews.
- Big Media reviewers are gaming the system and being ranked on page 1 of Google more than independent TV reviewers.
- Only 34 out of 119 (28.57%) TV reviewers on page 1 of the TV keywords we searched on Google are independently-owned.
- The remaining 85 reviewers (73.81%) belong to parent companies.
- The average Trust Rating of all 205 TV reviewers is 27.59%.
What Is The Problem With Product Reviews?
Imagine you’re shopping for a brand new TV. You’ll probably do some initial research on Google and read a TV review or two, right? In reality, 6.1 million TV review-related Google searches occur every month.
This enormous demand for online TV reviews has transformed the industry into a lucrative business, generating over $6 million in gross profit annually. Such high profits have also fostered greed, leading to a mass of fake reviews.
While there are some rigorously tested TV reviews, many are lost in the sea of fake and misleading content on Google’s search results pages.
This is our long-term investigation into TVs and is part of our broader examination of consumer tech fake reviews ranked by Google. The world’s biggest search engine is serving up misleading reviews, published by Big Media companies like CNN, Forbes, and Rolling Stone. These Big Media companies writing TV reviews are very popular and their TV content receive millions of visitors every month, but we’ve discovered that many are faking their reviews.
So, how widespread is this issue of fake reviews, why are Big Media outlets like Rolling Stone and Forbes writing these fake reviews, and how does this affect you?
How Widespread Is The Fake Review Problem?
After 155 hours of research, so far we’ve uncovered that 88% (181 out of 205) of the most popular TV reviewers DON’T test, and almost one-third of Google’s TV search results are fake reviews.
Apply that one-third to the millions of TV searches every month, and that means on page 1 of Google, users encounter approximately 20.3 million fake reviews every month (243.6 million fake reviews per year).
As people advocates, Gadget Review is on a mission to give people the truth about a system filled with fake reviews, skewed ratings, and deceptive online practices to restore trust in journalism.
By exposing these tactics, we equip you with the knowledge to make smarter purchases, saving you time and money.
Why Are There So Many Fake Reviews?
The TV industry has $7 billion in annual sales globally. From our internal numbers, the online TV review industry (for affiliates) boasts an annual gross profit of $6,806,142.
The allure of such high profits creates an environment susceptible to greedy behavior. Some reviewers take shortcuts that require little effort yet still rake in the dough, which are usually in the form of misleading, unreliable reviews. These fraudulent reviews can misinform consumers into wasting money and time on a total dud of a TV.
And why is Big Media a huge contributor to this problem? Large media conglomerates are abusing their authority to game Google and rank high in the search results with these low-effort TV reviews. We discovered that Google tends to rank parent companies’ sites higher than most other trustworthy, independent sites, even if the Big Media TV review is as fake as fake gets. Their ad models have evolved into a corrupted form of affiliate marketing.
While affiliate marketing in itself is not inherently unethical, publications and blogs cross the line when they compromise the integrity of their reviews and guides in exchange for higher profits.
DISCLAIMER: We’re not out to cancel anybody or tear anybody down. Our goal is to give people the truth about this huge fake review problem and restore trust in journalism as a result. While we email all reviewers we’ve analyzed, we’ve asked the failing reviewers who claim to test to either provide any missing testing evidence or to change their wording to “researched” instead of “tested”.
We analyzed our older untested reviews and realized our “tested” phrasing was problematic, so last summer, we changed all testing mentions on those reviews to “researched”.
We’ll provide another update soon about who responded to our emails and how they responded.
Gadget Review’s Investigation_
Gadget Review has gathered test data on almost 1,000 products in over a dozen categories including TVs, and now we’re testing the testers. We’ve been researching how trustworthy TV reviewers are since 2021, calculating Trust Ratings for 205 reviewers in total.
We developed our proprietary Trust Rating system to classify trustworthy, untrustworthy, and fake TV reviewers. Calculating a Trust Rating is a hands-on approach since we have real people research each publication and fill out 70 indicators to gauge how they practice transparency and thorough, proven TV testing.
You can learn more about how we test the testers and some of the indicators we use.
The final Trust Rating of a site is a weighted calculation. If a site reviews multiple categories, they’ll receive a Trust Rating for each category:
- 20% of the Trust Rating is the General Score. It’s based on how transparent the site is in general along with how in-depth their scoring system is. It’s scored only once.
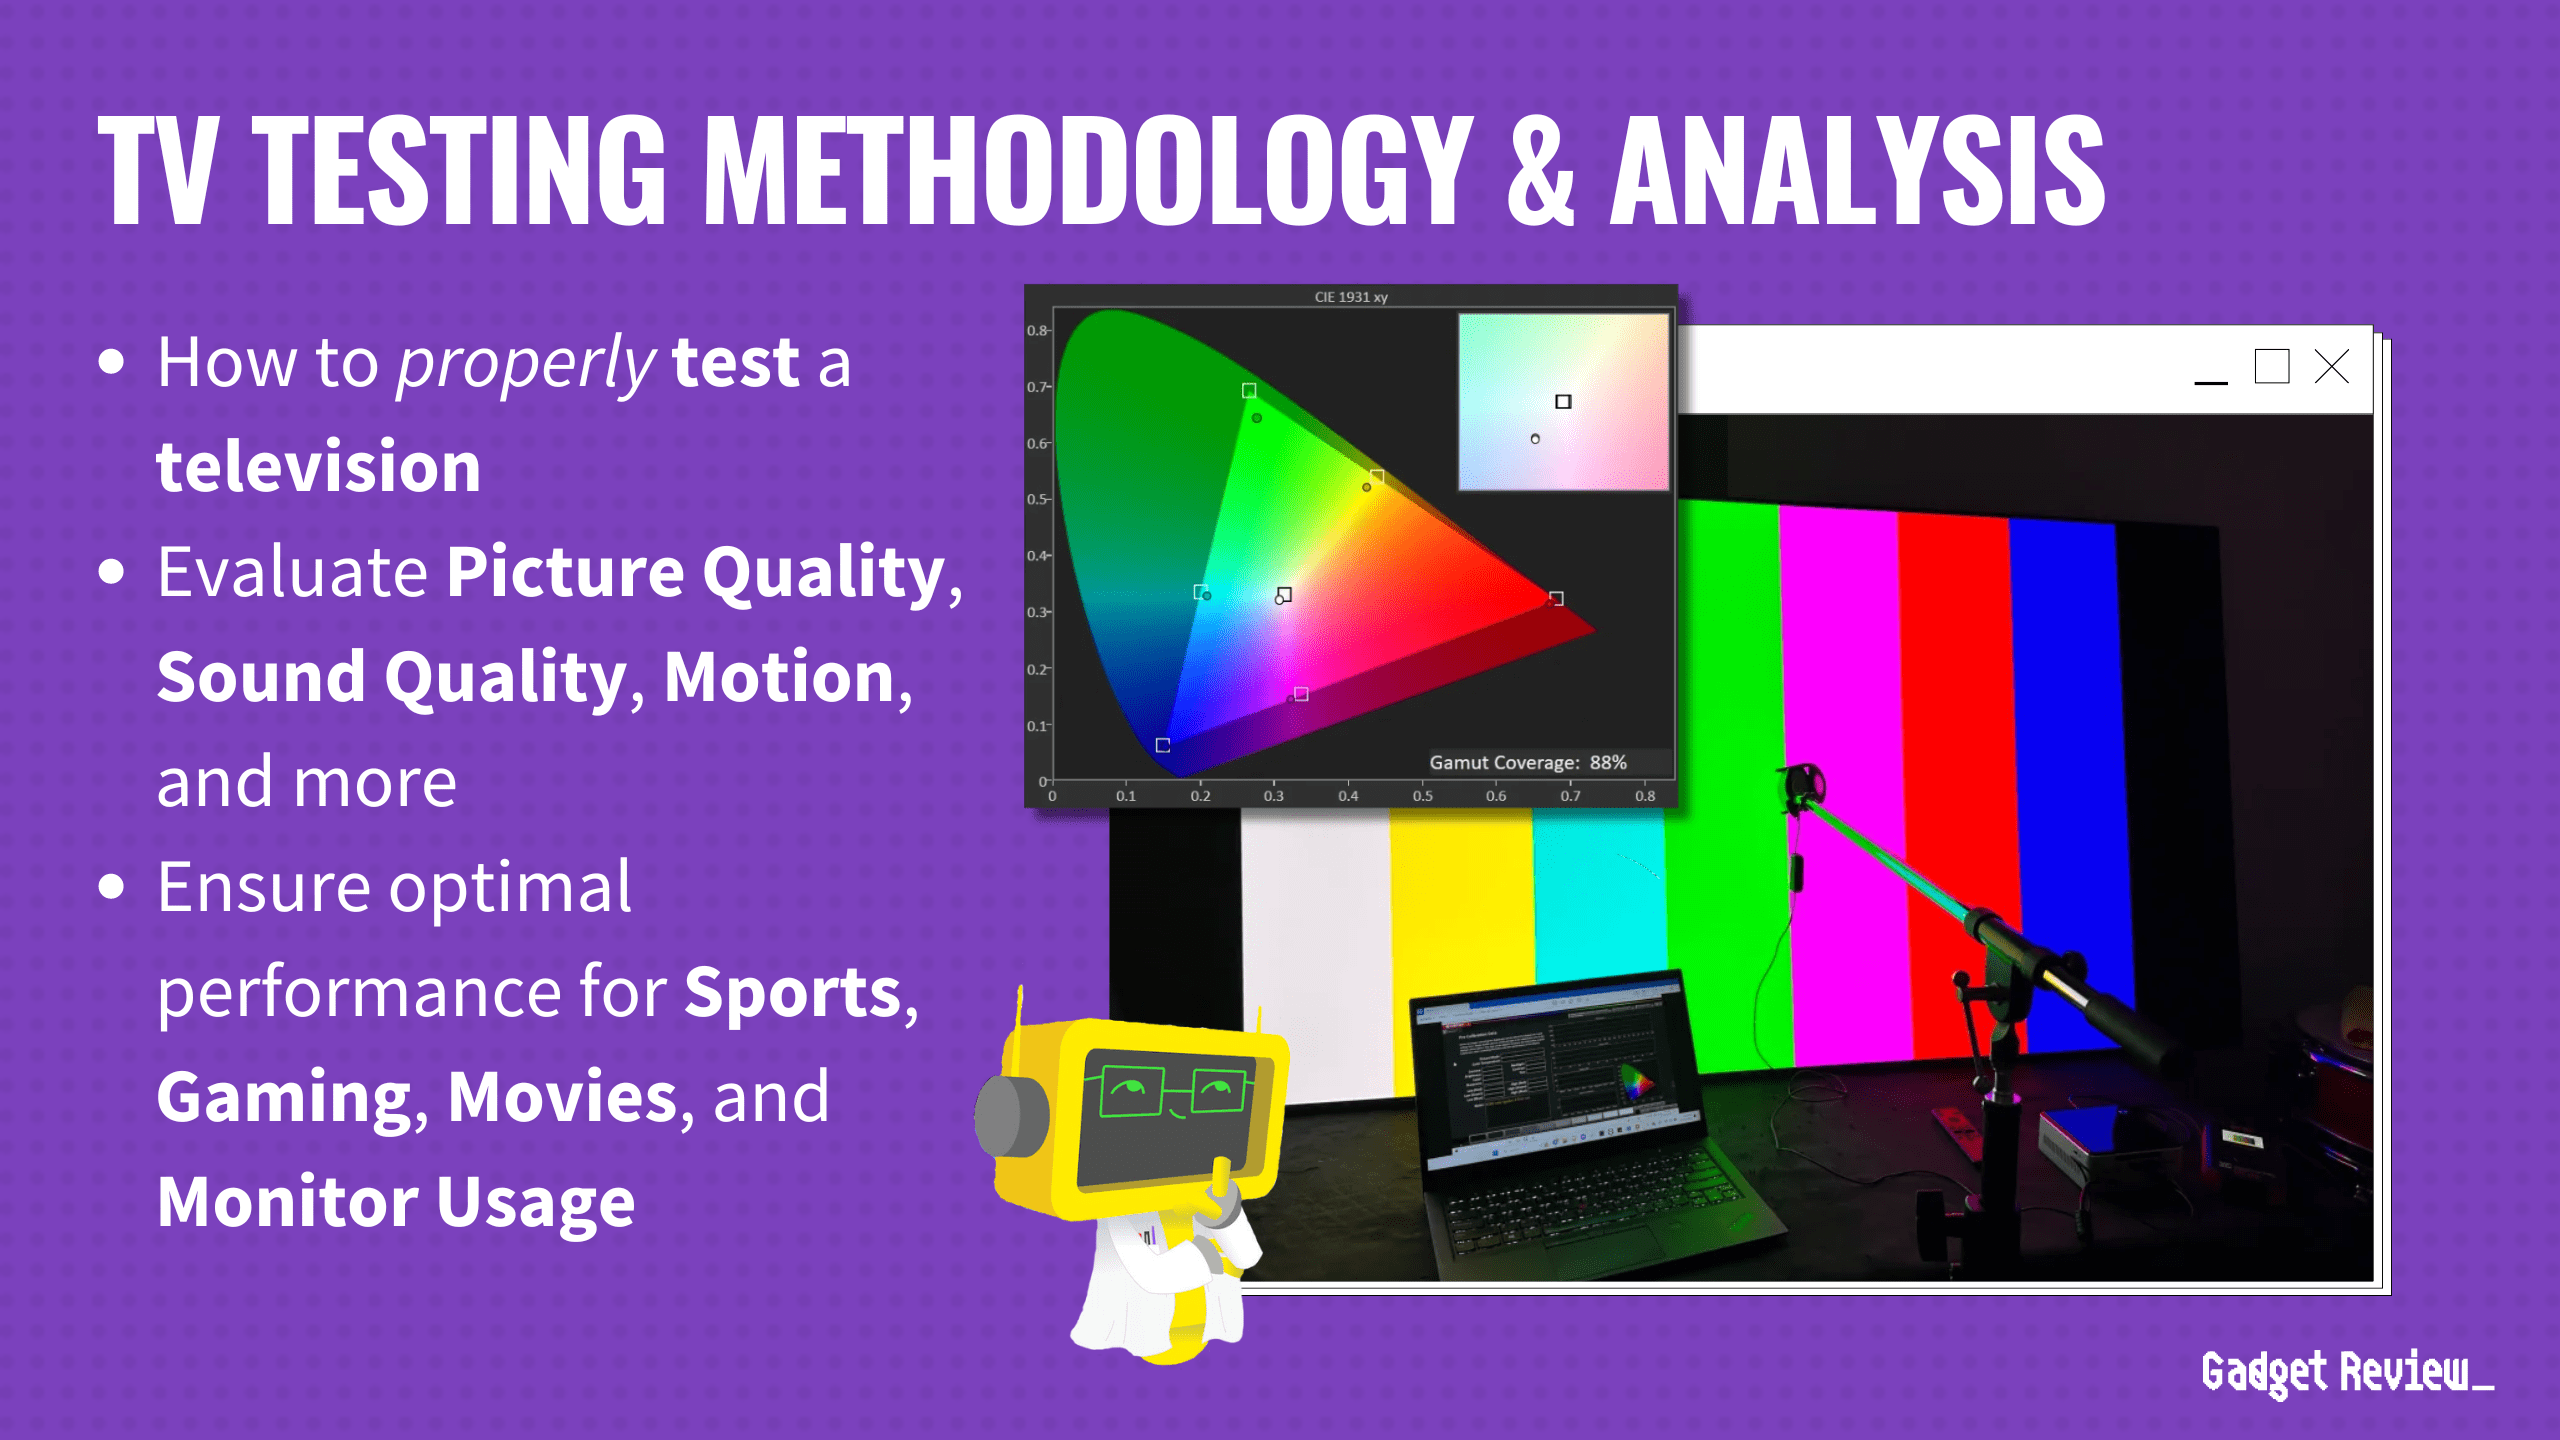
- The other 80% is the Category Score. This is determined by how in-depth the testing is on their reviews. Each category receives their own custom questions looking for important Test Criteria applicable to the category, such as brightness for TVs. We explain our process to determine important TV Test Criteria in our TV Testing Methodology.
Overall TV Key Findings_
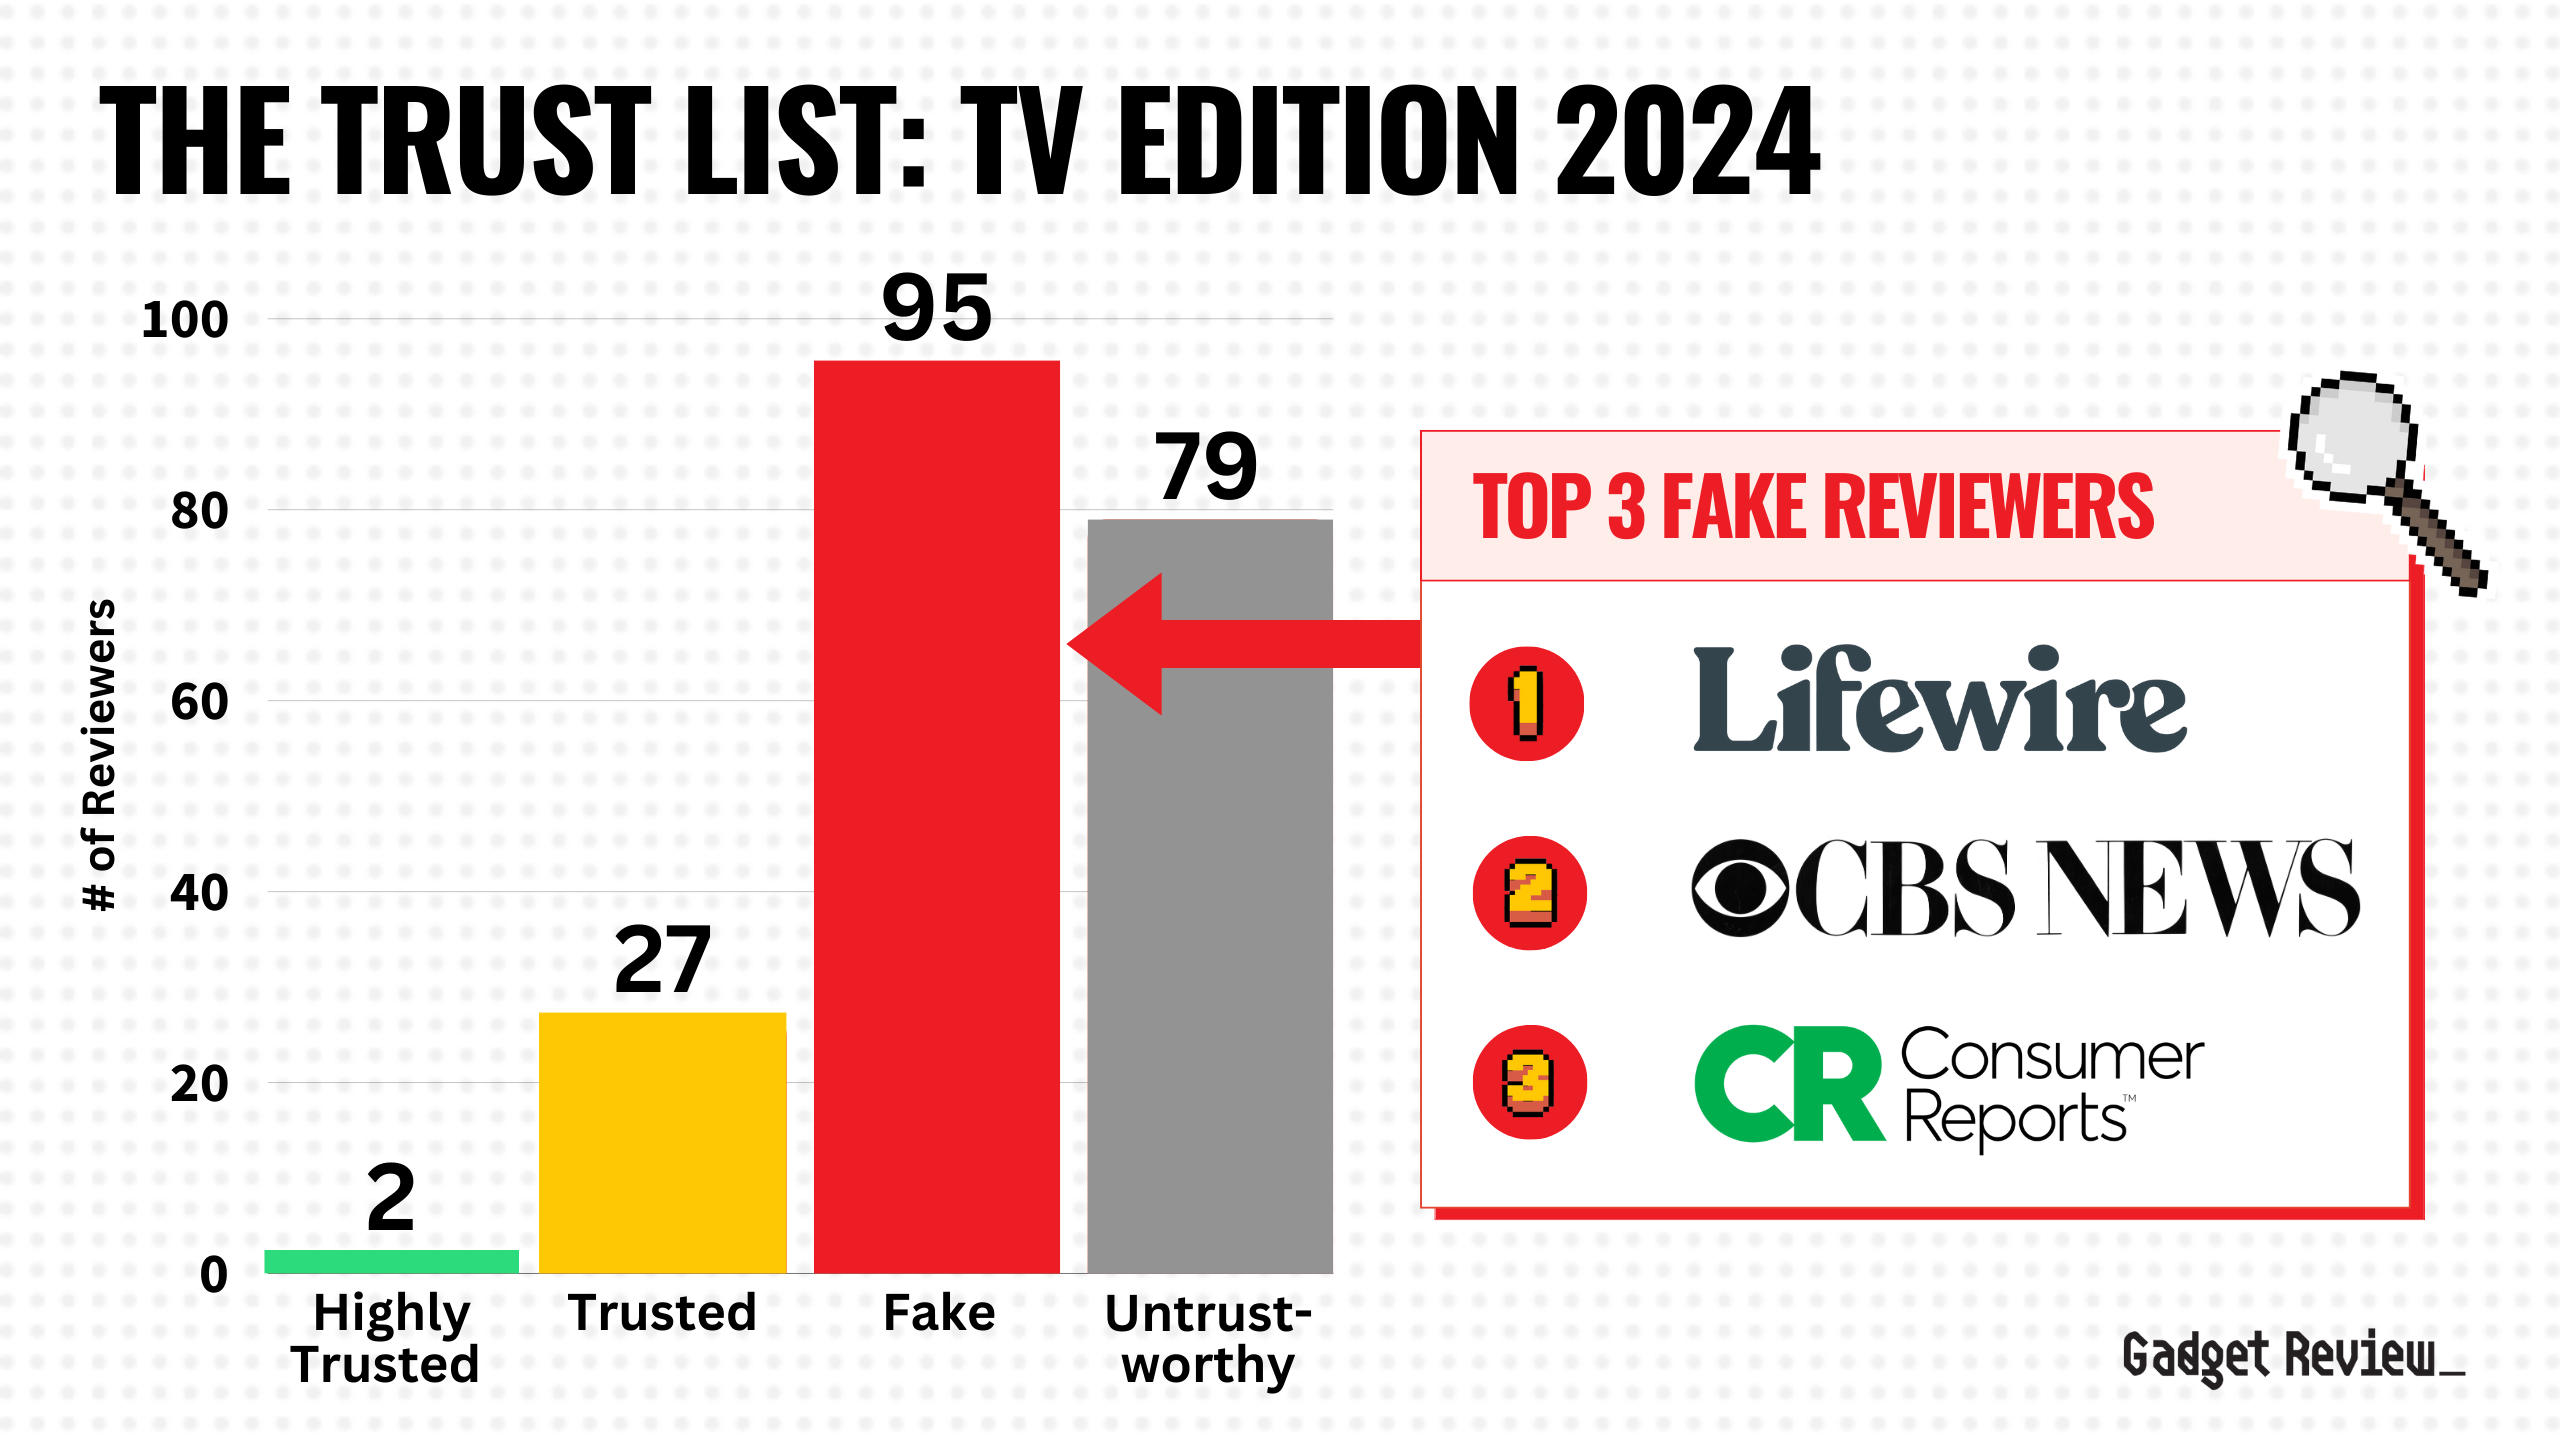
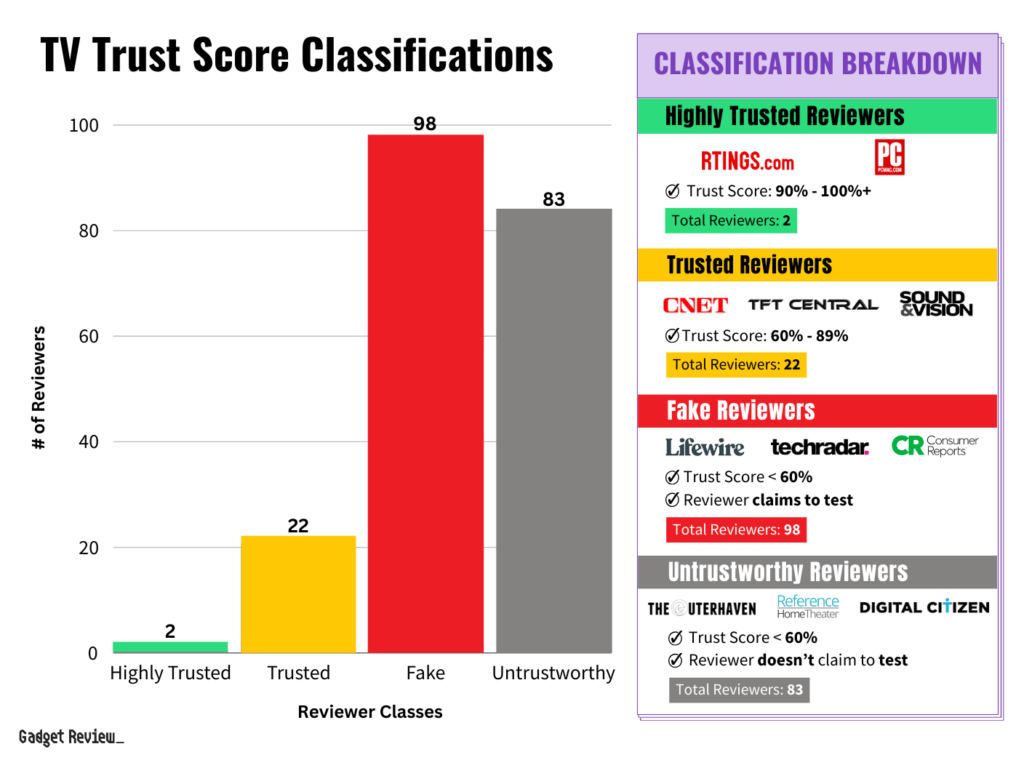
We found that 47.80% of the 205 reviewers are fake reviewers, and only 11.71% of the 205 reviewers are either Highly Trusted or Trusted Reviewers. The rest (83 of the 205 reviewers so 40.49%) do not claim to test but are still untrustworthy.
The landscape of online TV reviewers looks rather grim with a 27.59% average Trust Rating of all 205 reviewers. Here’s a table of all our overall findings:
| GROUP | # OF REVIEWERS | PERCENTAGE |
|---|---|---|
| Highly Trusted Reviewers (Trust Rating: 90 – 100%+) | 2 | 0.98% |
| Trusted Reviewers (Trust Rating: 60 – 89%) | 22 | 10.73% |
| Fake Reviewers (Say They Test + Failing Trust Rating < 60%) | 98 | 47.80% |
| Untrustworthy (Don’t Say They Test + Failing Trust Rating) | 83 | 40.49% |
It’s concerning how the Fake Reviewers class is the largest group out of the 205 reviewers. Here’s a bar chart illustrating how few trusted reviewers actually exist online.
The above are the 205 Trust Ratings in general, but how does this apply to the real world and affect you in every day life? How many of these fake reviewers are on page 1 of Google? What does a fake TV review look like?
Fake Reviews In Google Search Results_
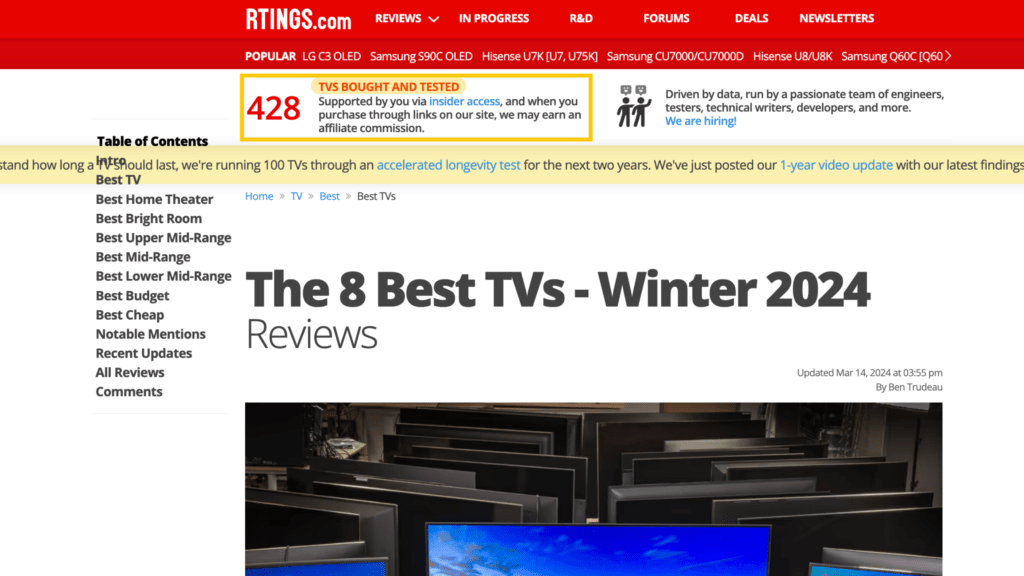
Below is an example of a popular yet problematic page 1 of Google for the keyword “best tv for bright room” which earns 1,600 searches a month. There are six unique expert publications (RTINGs appears twice at the top and bottom) and three forums:
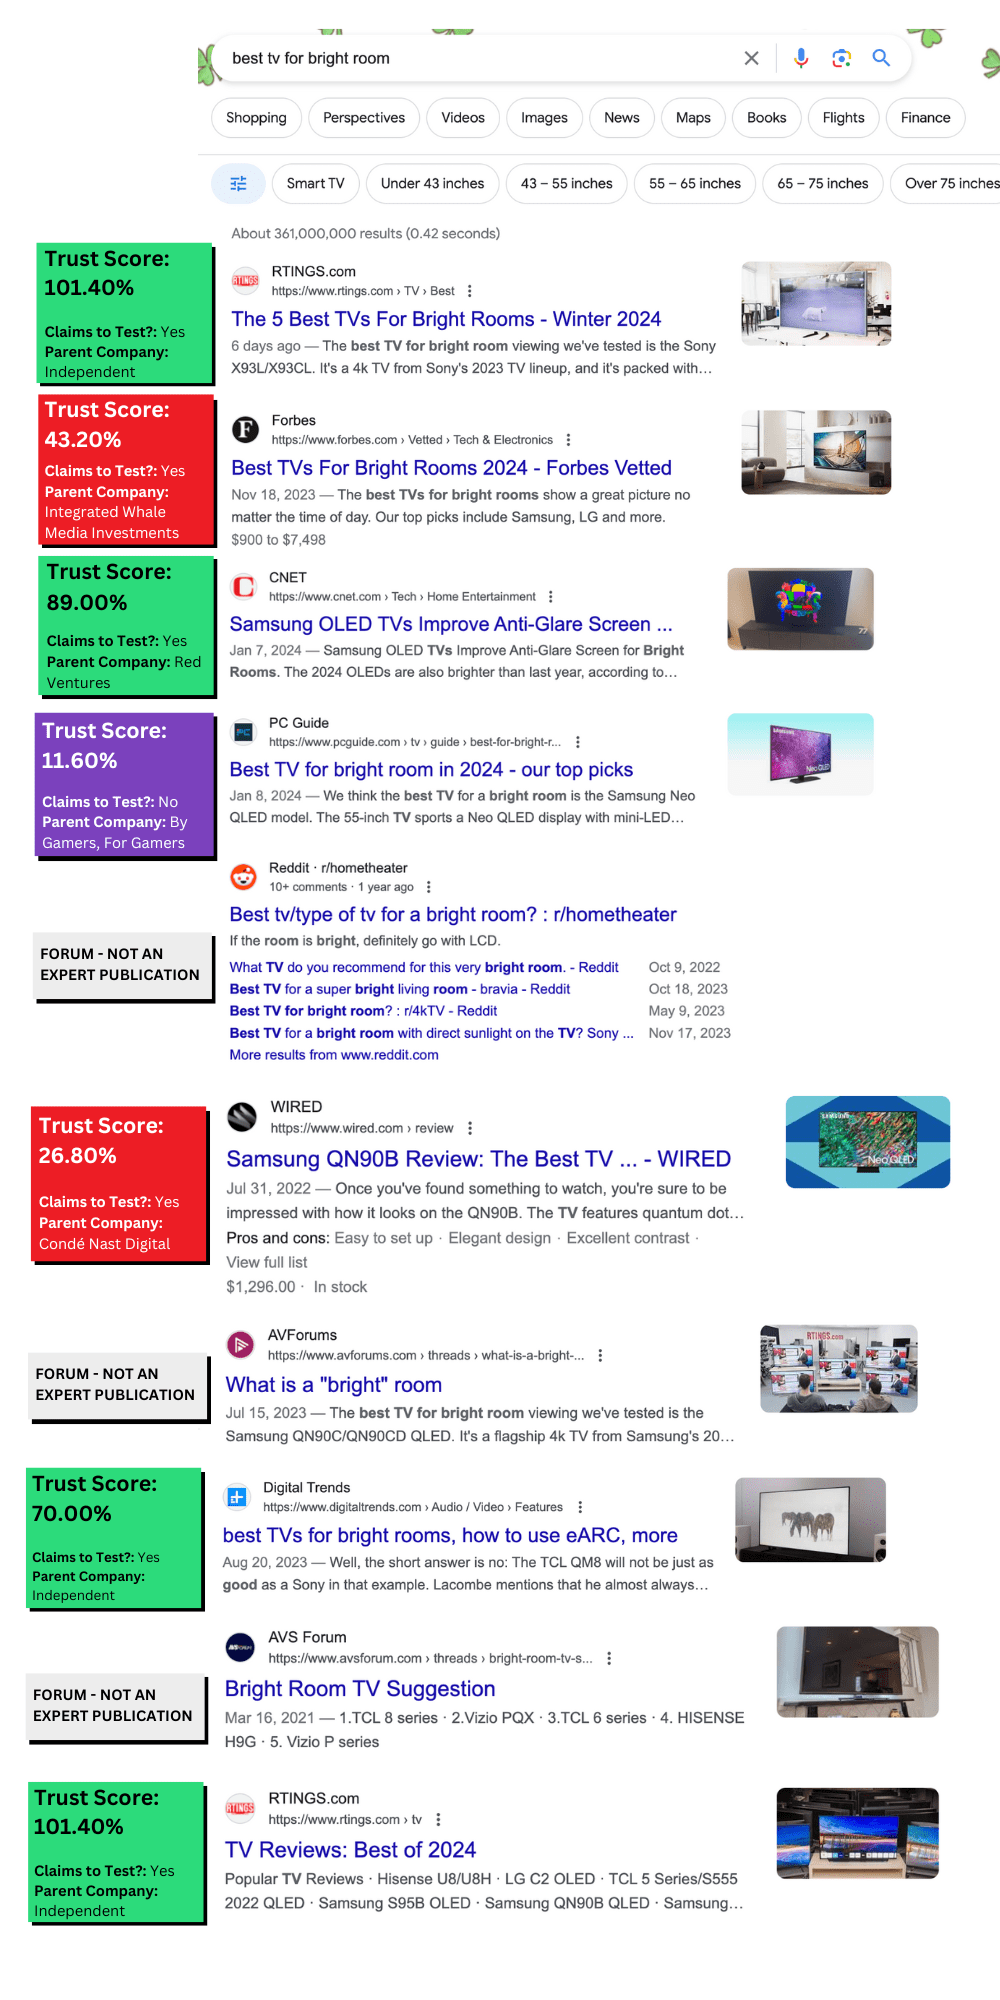
Out of the six publications:
- 3 are Trusted Reviewers (reviewers who say they test and have at least a 60% Trust Rating)
- RTINGs, CNET and Digital Trends
- 2 are Fake Reviewers (reviewers who say they test but have under a 60% Trust Rating)
- Forbes and Wired
- 1 is an Untrustworthy Reviewer (reviewers who don’t claim to test but they earned under a 60% Trust Rating)
- PC Guide
- 2 are independent, and the other 4 belong to a parent company.
- Independent: RTINGs and Digital Trends
- Owned by a Parent Company: Forbes, CNET, Wired, and PC Guide
So you have a 50% chance of reading a fake or untrustworthy review amongst these search results. Here’s a table of the page 1 results:
| POSITION | SITE | TYPE OF SITE | TRUST SCORE | CLAIMS TO TEST? |
|---|---|---|---|---|
| 1 | RTINGs | Publication | 101.40% | Yes |
| 2 | Forbes | Publication | 43.20% | Yes |
| 3 | CNET | Publication | 89.00% | Yes |
| 4 | PC Guide | Publication | 11.60% | No |
| 5 | Forum | N/A | N/A | |
| 6 | Wired | Publication | 26.80% | Yes |
| 7 | AVForums | Forum | N/A | N/A |
| 8 | Digital Trends | Publication | 70.00% | Yes |
| 9 | AVS Forum | Forum | N/A | N/A |
| 10 | RTINGs | Publication | 101.40% | Yes |
Forbes, WIRED, Rolling Stone, and other Big Media publications have transformed into content factories, pumping out misleading, low-effort buying guides with affiliate links at a rapid pace. This is suspicious behavior because every true TV tester knows that buying guides take a long time to produce. A guide needs thoughtful, thorough testing and research performed for each TV model.
Forbes’ Fake TV for Bright Rooms Buying Guide
Trust Rating: 43.20% | Position on SERP: 2 | Buying Guide
Forbes’ TVs for Bright Rooms guide is filled with stock images and makes no sense to be placed higher than CNET and Digital Trends who actually tested their TVs.
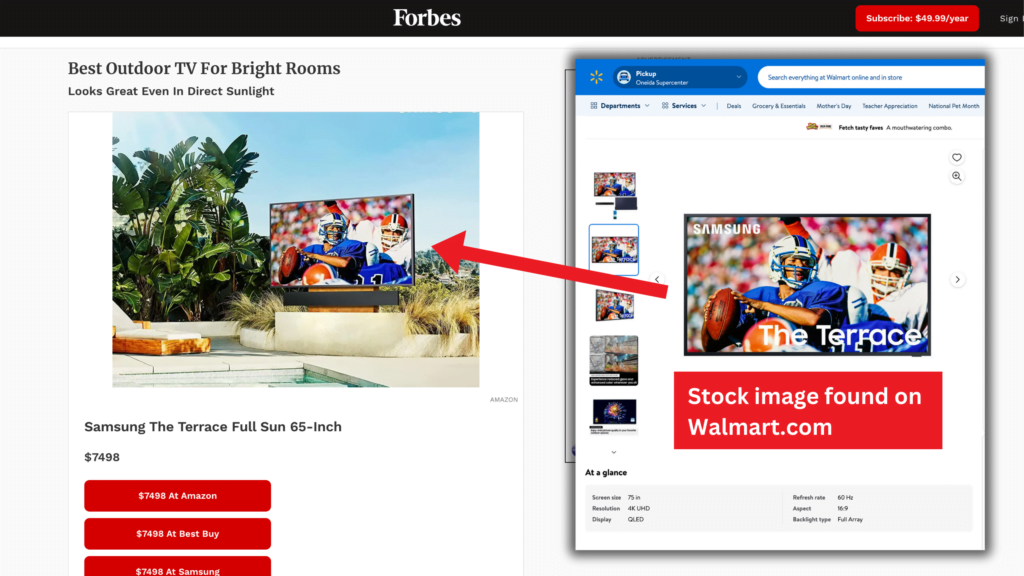
It gets more sketchy when Forbes claims to have performed “hands-on” testing, but you can’t find any quantitative measurements of the performance criteria that determine the true performance of the TV, such as brightness, response time, and color gamut.
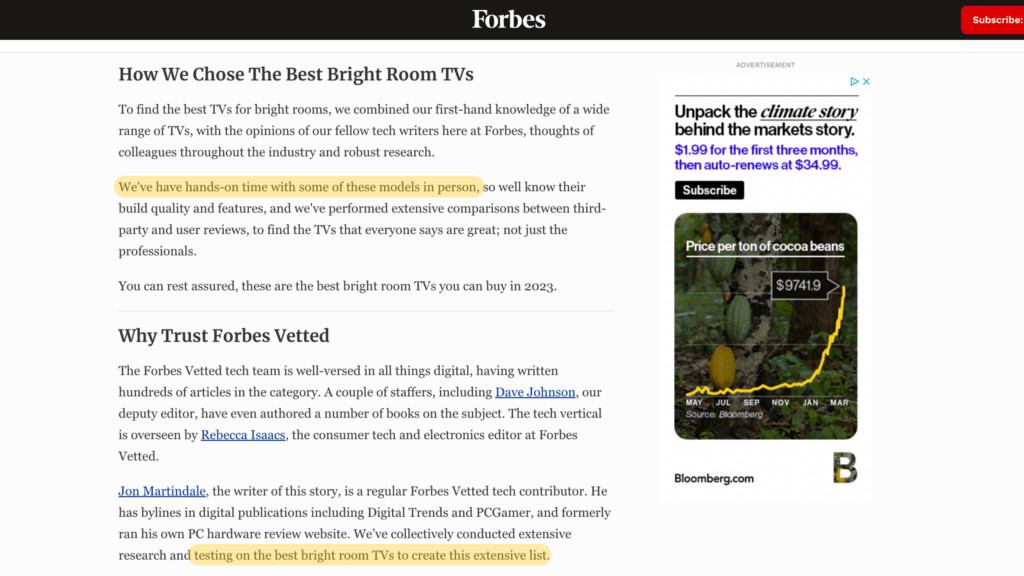
For Forbes, this means they didn’t actually test the TV. It’s just a page of flowery text describing the TV specifications provided by the manufacturer.
WIRED’s Fake Review of the Samsung QN90B
Trust Rating: 26.80% | Position on SERP: 6 | Product Review
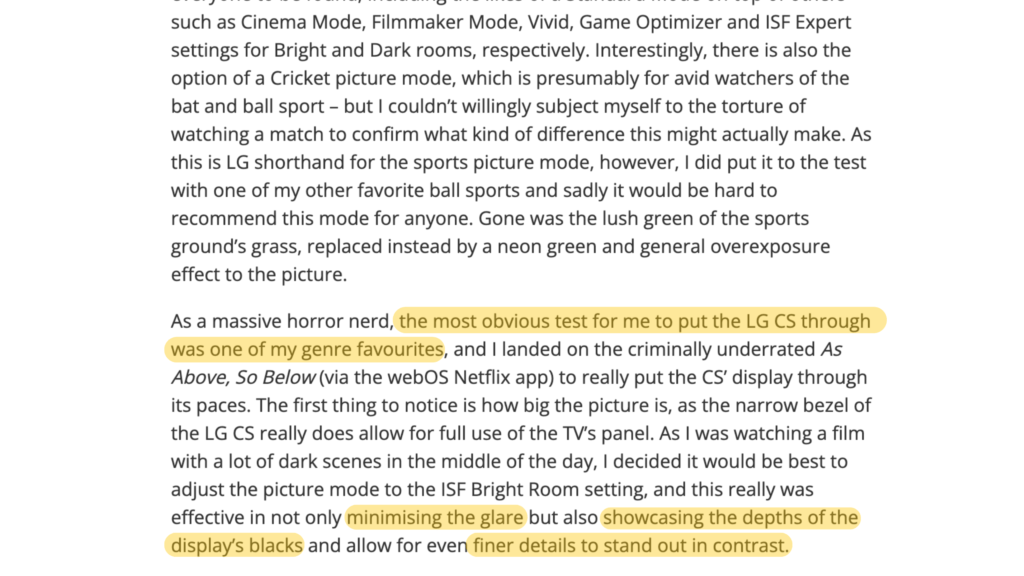
The other fake review on the page 1 search results is WIRED’s review on the Samsung QN90B. The author doesn’t explicitly say “tested” in the review (you can find “tested” mentions on their other TV reviews and guides), but WIRED isn’t off the hook yet since they insinuate it in the review. The author talks in the past tense and in first-person to recall his experience using the TV. He also says “evaluate” while claiming to have reviewed the TV’s color accuracy and light bleed by playing Stranger Things and Star Wars on it.
However, there’s no visual proof or quantitative test results to back up his positive evaluations of the picture quality.
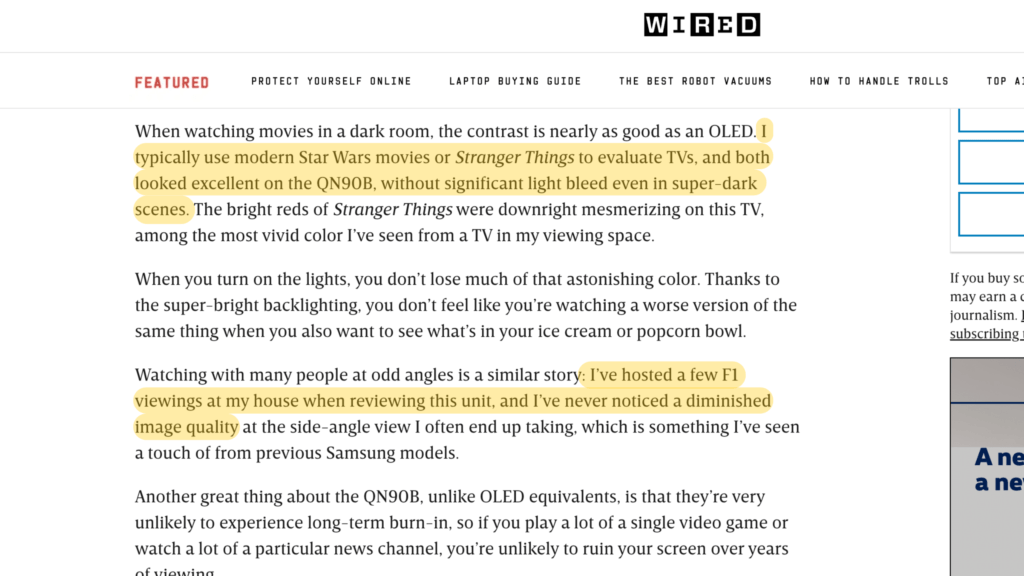
WIRED strangely puts more effort into adding colored backgrounds to stock images of the Samsung than publishing real photos of the TV, which would be way more helpful.
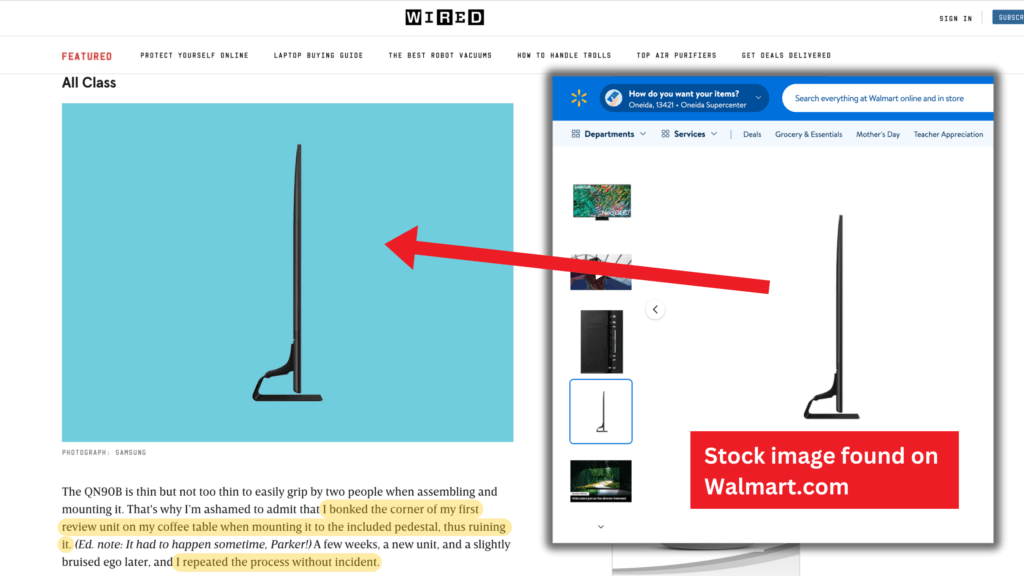
We can assume that the author spent days with this TV since he claims to have “hosted a few F1 viewing at his house when reviewing the unit”, so where are those real photos?
How Detailed.com and HouseFresh Have Also Exposed Flaws in TV Review Rankings
Our investigation, Detailed.com founder Glen Allsopp’s study, and HouseFresh founder Danny Ashton and Editor Gisele Navarro’s assessment validate the importance of the problem of Big Media outranking many independent publishers with low-effort reviews.
Our research quantitatively determined how few trustworthy TV reviewers there are and how Google presents fake reviews in 30% of its search results.
The Detailed.com study found that only 4 out of the top 100 sites for affiliate SERPs are independent. HouseFresh’s “David vs. Digital Goliaths” article also validates how Google’s algorithm has changed and ranks big media publishers high despite them producing fake reviews.
KEY STATISTIC_
Almost ⅓ of search results on page 1 of Google are fake TV reviews—the publications who say they test but have a Trust Rating below 60%.
Gadget Review, TV Trust List 2024
As for the other categories that Gadget Review has researched, we’ve found more concerning statistics:
- For soundbars, 10 of the 122 publications analyzed actually perform tests on their soundbars. That means only 8% of publications test soundbars.
- For robot vacuums, 15 of the 78 (so 19%) publications actually test the robot vacuums they review.
- For computer monitors, 33 of the 116 publications we analyzed actually test their monitors, meaning only 28% of publications test.
Our Google Search Results Analysis_
We wanted to see just how much fakery users encounter when searching for TV reviews on Google. To do so, we researched 205 reviewers and applied the Trust Ratings to page 1 of the Google search results for TV-related keywords.
To ensure keyword diversity, we made sure their search volume added up in total to 50,000-60,000 searches per month. So annually, there are 720,000 unique individuals searching these TV keywords annually.
We took a look at page 1 of the search results for 18 TV keywords, and we found out that 720,000 people have a 31.09% chance of encountering a fake tested review.
When we investigated these 18 different page 1’s in March 2024, we first had to filter out all the forums and online retailers out of the total 161 search results. We were left with 119 expert publication reviewers.
Out of the 119 publication search results, again, 31.09% are fake reviews published by TV Reviewers that earned failing Trust Ratings and claimed to test the TVs.
Here’s a breakdown of our search result findings:
| GROUP | # OF REVIEWERS | PERCENTAGE |
|---|---|---|
| Total Publications in Search Results | 119 | 100% |
| Search Results from Trusted Reviewers (Says They Test + Passing True Score ≥ 60%) | 76 | 63.87% |
| Search Results from Fake Reviewers (Says They Test + Failing True Score < 60%) | 37 | 31.09% |
| Search Results from Untrustworthy Reviewers (Don’t Say They Test + Failing Trust Rating < 60%) | 6 | 5.04% |
Though the presence of any fake reviews on page 1 of Google is concerning, this 31.09% is an improvement from our October 2023 search analysis, where we found that 37.09% of the search results were fake reviews.
The Fake Five_
Let’s talk about the five most popular TV reviewers that earned a failing Trust Rating under 60% and say they test. They earn the most traffic by ranking for the most TV keywords. These keyword market shares were identified in March of 2024 on Ahrefs.
We filtered their organic keywords to only show keywords that contain either “tv”, “tvs”, “televisions” or “television”. Then we excluded keywords that contain “show”, “shows”, “episode”, “episodes”, “stream”, “streaming”, “antenna”, “antennas”, “character”, or “characters” so we don’t get keywords related to TV programs or TV accessories.
Publication #1: Lifewire
Trust Rating: 48.40% | Buying Guide Example | Review Example
Lifewire’s the first of the Fake Five due to their large TV keyword marketshare of 124,297. They were founded in 1982 and belong to the famous Dotdash Meredith media conglomerate.
Trust Analysis:
- Trust Rating: 48.40%
- Parent Company: Dotdash Meredith
- Type of Reviewer: Multiple Tech Review
- Total TV Keywords: 124,297
- How they earn their money: Affiliate programs, Advertisements, Sponsored posts
- Did they respond to our email?:
Read More
Testing Quality Analysis:
- Do they claim to test TVs?: Yes
- Do they have a TV Testing Methodology?: No
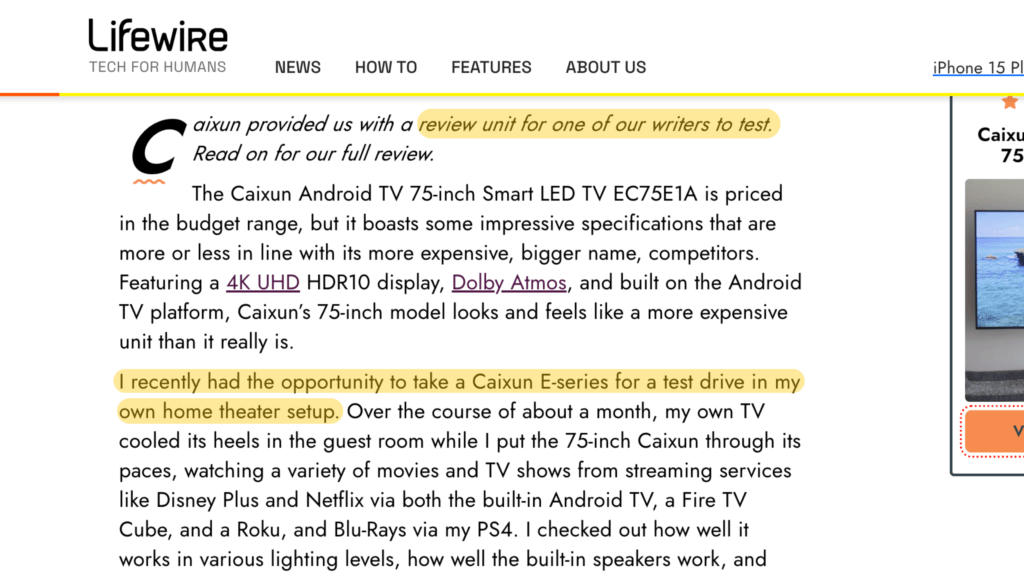
Though Lifewire makes it seem like they tested these TVs, their reviews lack enough evidence to prove that adequate testing was actually performed.
While there are original photos that help to confirm that they did actually have the televisions in front of them at one point, they do not have any quantitative measurements that they discovered during their time with the TVs.
Additional charts and graphs would make these reviews more convincing. None of the custom questions we’ve laid out are addressed in the three reviews we sampled, which means there’s no hard numbers or data/graphs for input lag, peak brightness, color gamut or contrast.
Read Less
Publication #2: TechRadar
Trust Rating: 56.60% | Buying Guide Example | Review Example
Next on our list is TechRadar, a popular tech-focused publication founded in 2008 that’s one of sixteen reviewers we evaluated that are owned by Future PLC.
Trust Analysis:
- Trust Rating: 56.60%
- Parent Company: Future PLC
- Type of Reviewer: Multiple Tech Review
- Total TV Keywords: 108,338
- How they earn their money: Affiliate programs, Advertisements, Sponsored posts
- Did they respond to our email?:
Read More
Testing Quality Analysis:
- Do they claim to test TVs?: Yes
- In fact, they state in all their reviews and guides: “We spend hours testing every product or service we review.”
- Do they have a TV Testing Methodology?: No

TechRadar’s failing score is owed in part to their claims of testing on their TV reviews, which is only sometimes true. Though one of the three reviews sampled included measurements for input lag (in ms) and peak brightness (in nits), these measurements were absent from other two reviews, along with answers to the remaining two custom questions (color gamut and contrast.)
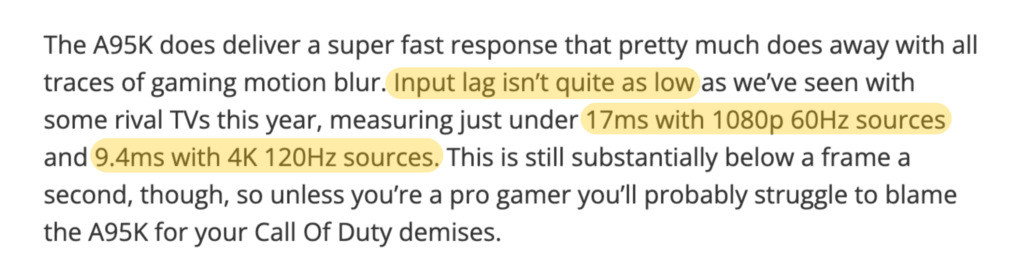
We don’t doubt that TechRadar actually got the televisions, based on their photos, but their testing leaves a lot to be desired on some of their reviews. Inconsistency between measurements and vague descriptive “results” creates a problem for the consumer, as it becomes difficult to know if a review is going to be well-made and the product of careful testing or not.
Read Less
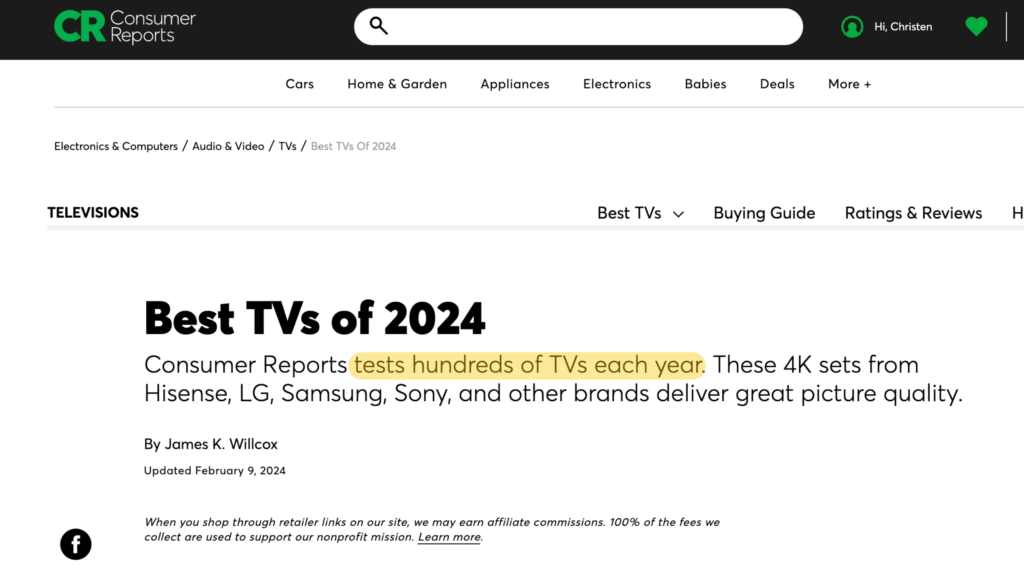
Publication #3: Consumer Reports
Trust Rating: 35.40% | Buying Guide Example | Review Example
Despite their reputation for “tested” product reviews, Consumer Reports, founded in 1936 is third on our list due to the lack of transparency and actual test results. And even worse, the non-profit’s fake reviews are hidden behind a paywall.
Trust Analysis:
- Trust Rating: 35.40%
- Parent Company: N/A – Independent
- Type of Reviewer: Multiple Tech Review
- Total TV Keywords: 100,747
- How they earn their money: Affiliate programs, User subscriptions, Investors (Note that they’re a non-profit*)
- Did they respond to our email?:
Read More
Testing Quality Analysis:
At the time of this report, we’ve reached out to Consumer Reports for actual test results and units of measurement.
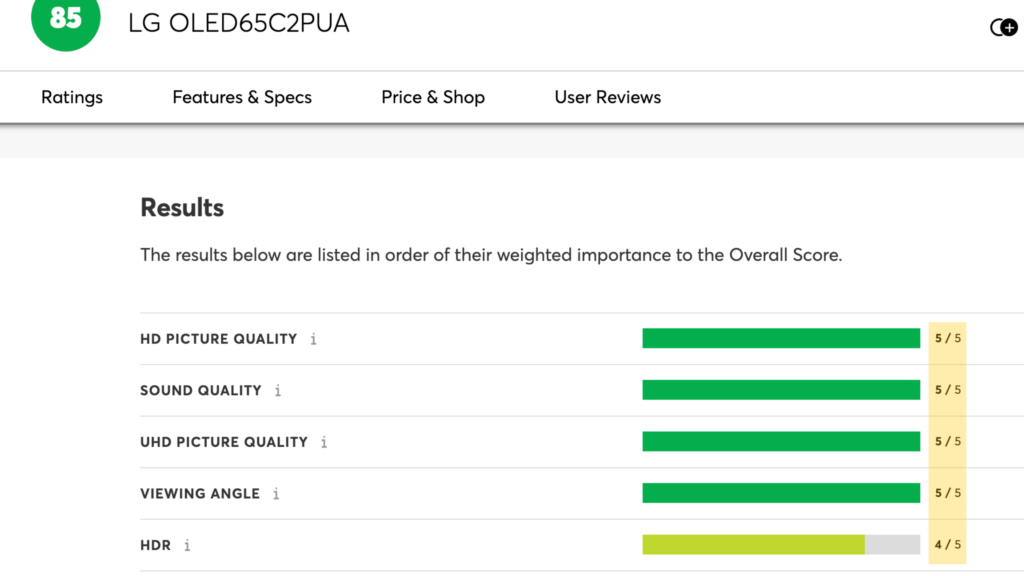
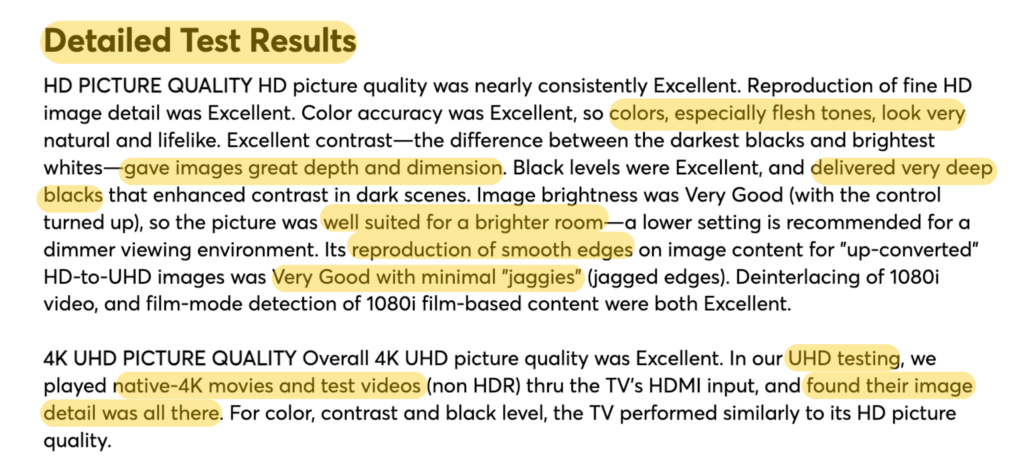
They say they test, but there’s little evidence provided to show it. Worse still, the paywall is a barrier to entry. Scoring system is a breakdown of multiple criteria, which is good. Their results section on their reviews is decently sized, with ratings given to multiple criteria, but there are no photos, graphs or charts to help confirm to the reader that the testing they claim to do was actually performed.
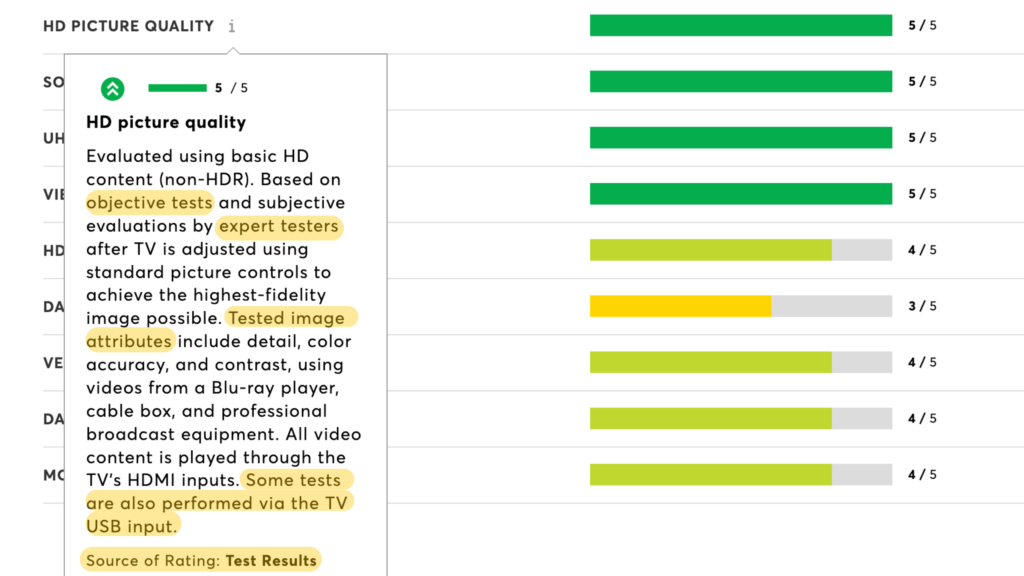
They provide a “detailed results” section that uses qualitative language instead of quantitative data to drive their points, so instead of seeing a color gamut graph or contrast screens, we just get statements saying brightness is “very good” or contrast is “excellent.”
* A “Non-Profit” is an organization that operates for purposes other than generating profit.
Read Less
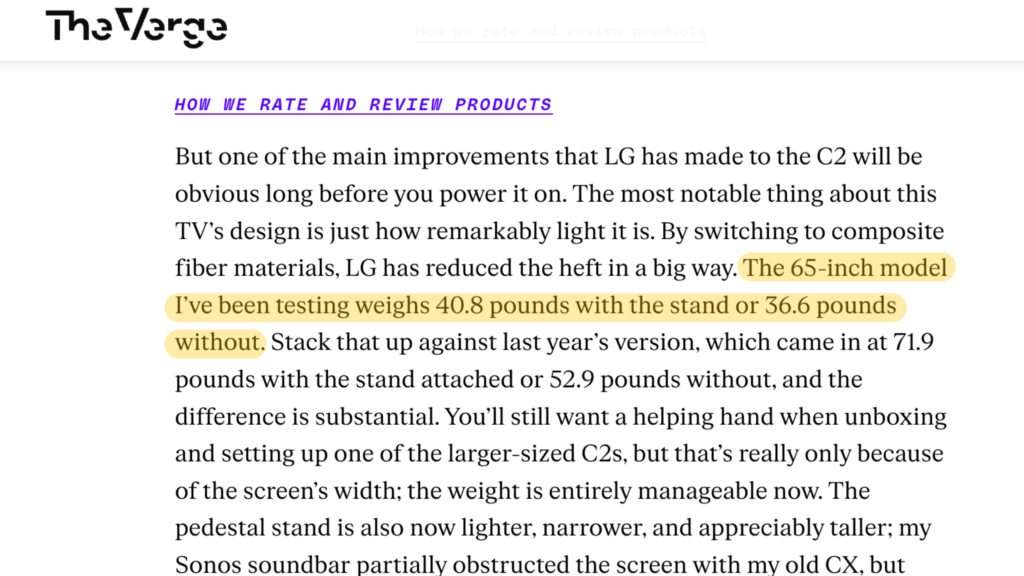
Publication #4: The Verge
Trust Rating: 34.40% | Buying Guide Example | Review Example
The Verge, belonging to Vox Media, publishes TV reviews that include simple images of the TVs but lack testing and test result charts.
Trust Analysis:
- Trust Rating: 34.40%
- Parent Company: Vox Media
- Type of Reviewer: Niche News
- Total TV Keywords: 73,541
- How they earn their money: Affiliate programs, Advertisements, Sponsored posts
- Did they respond to our email?:
Read More
Testing Quality Analysis:
- Do they claim to test TVs?: Yes
- Do they have a TV Testing Methodology?: No
We don’t deny that they actually had the TVs in front of them and used them, for their real images clearly prove that. However, their content does not include images showing hardware testing equipment, screenshots of test results, etc. This absence raises concerns about the thoroughness of their testing process.
The lack of transparency regarding their testing methods and tools further undermines their credibility. Though they describe their impressions of important performance criteria like contrast and color quality, their quantitative test results to support their claims are nowhere to be found.
Read Less
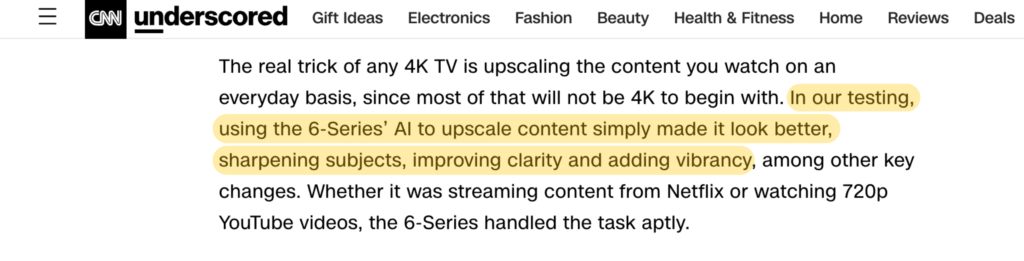
Publication #5: CNN
Trust Rating: 32.40% | Buying Guide Example | Review Example
The famous CNN founded in 1980, despite its reputation as a news outlet under Warner Bros. Discovery, wound up on our list since they decided to dip their toes into the world of product reviews with their own that lack comprehensive testing.
Trust Analysis:
- Trust Rating: 32.40%
- Parent Company: Warner Bros. Discovery
- Type of Reviewer: General News
- Total TV Keywords: 73,176
- How they earn their money: Affiliate programs, Advertisements, Sponsored posts
- Did they respond to our email?:
Read More
Testing Quality Analysis:
They certainly used these TVs, but their testing claims are rather weak. In their reviews, they have multiple real photos of the TVs. One features a real person mounting the TV, but we realize in the review that that person is the hired installer, not the author.
CNN does provide a TV testing methodology, but the actual reviews lack quantitative testing evidence. They do discuss certain criteria, though they forgot about input lag. They compare the model to other TVs, which is a great concept, but test results would support why the author thinks one is better than the other for certain criteria.
Read Less
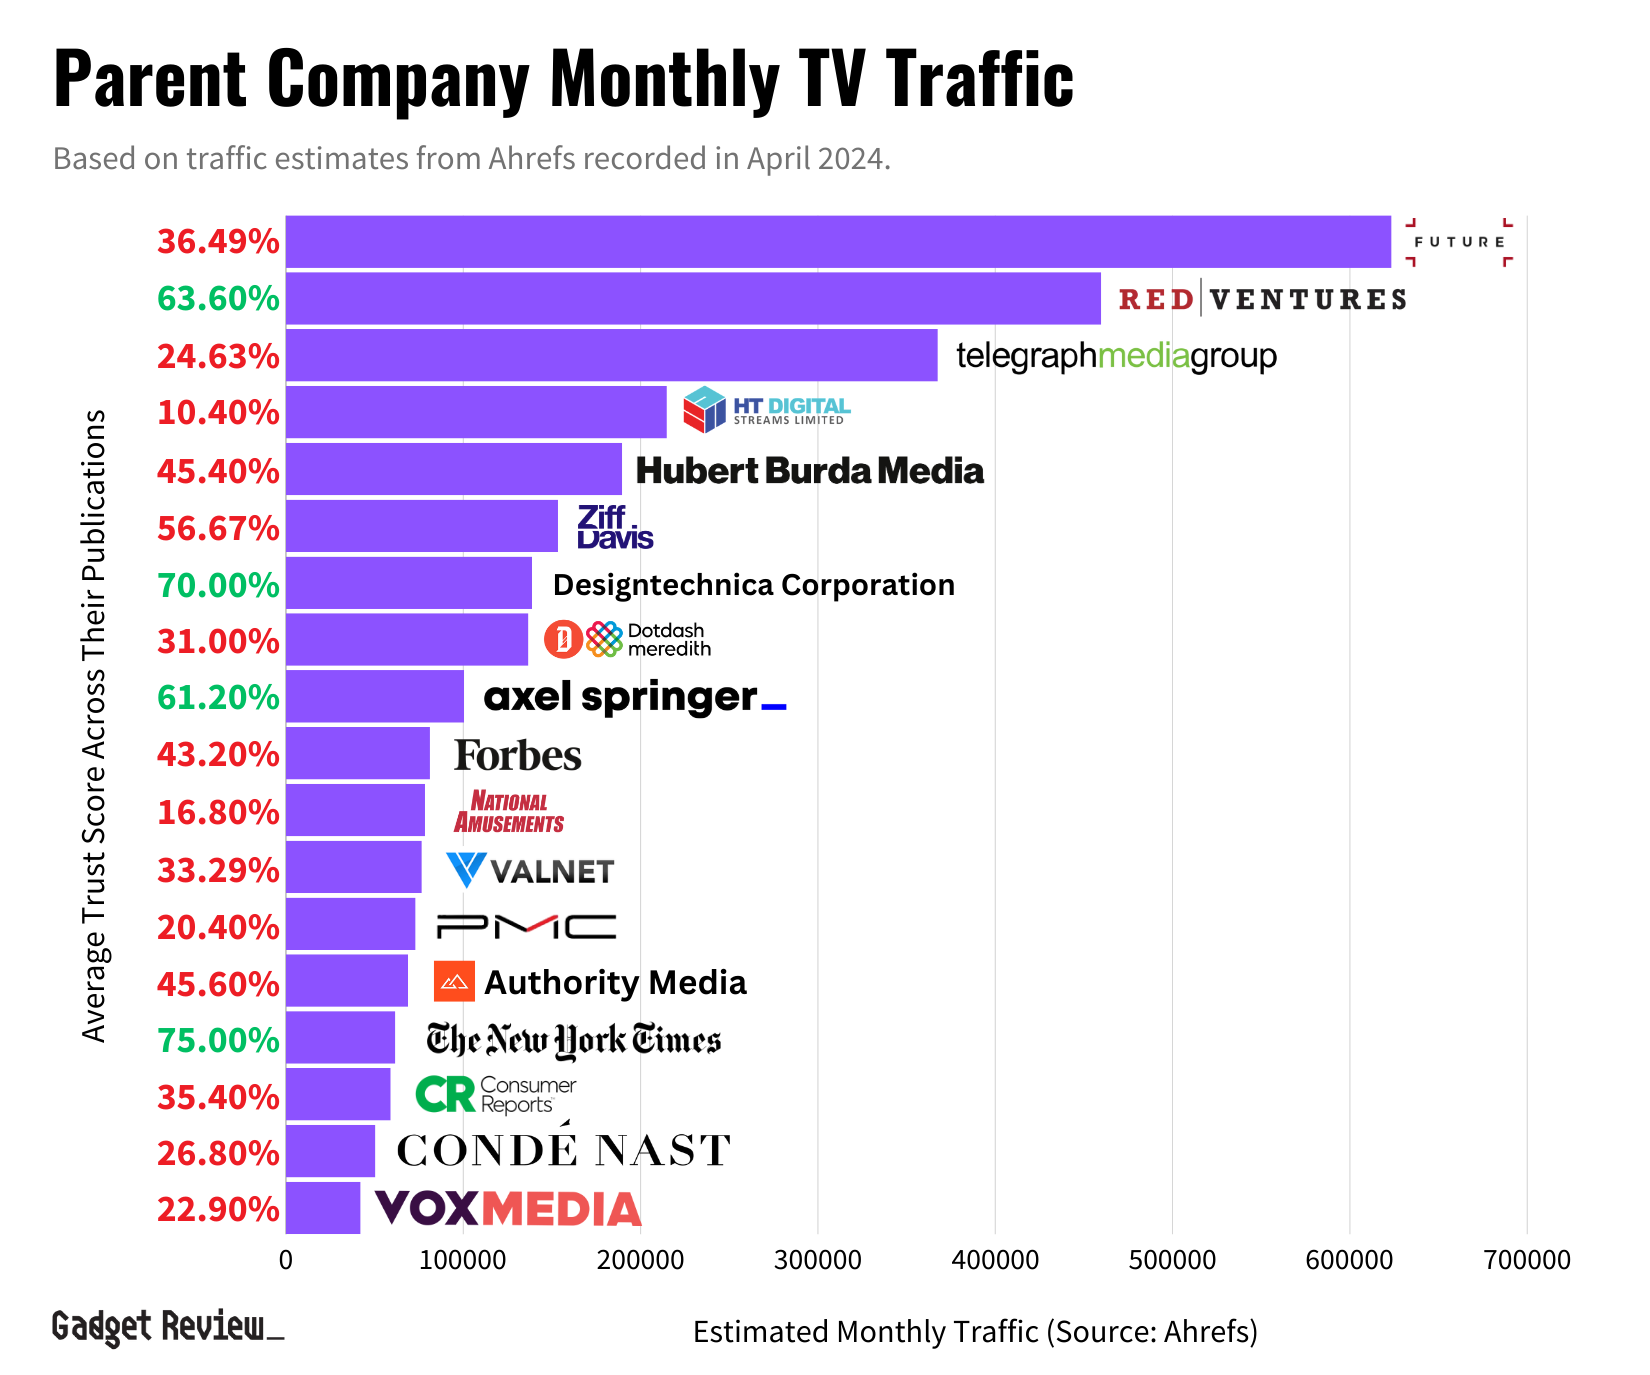
Parent Companies Dominating The Search Results_
We wanted to determine how many TV reviewers in the Google search results are independent and how many belong to a parent company. Independent sites possess slightly over one-fourth of the search results, implying that Google prefers to rank TV reviewers who belong to large parent companies, several of which are gaming the system with fake reviews.
| RANK | PARENT COMPANY | SEARCH RESULTS COUNT | % OF SEARCH RESULTS POSSESSED |
|---|---|---|---|
| 1 | Future PLC | 36 | 30.25% |
| 2 | No Parent Company | 34 | 28.57% |
| 3 | Red Ventures | 16 | 13.45% |
| 4 | Ziff Davis | 7 | 5.88% |
| 5 | New York Times | 5 | 4.20% |
Click “read more” below for the full table.
As you can see, Future PLC holds the largest portion of the search results out of any other parent company (almost one-third of the 119 search results).
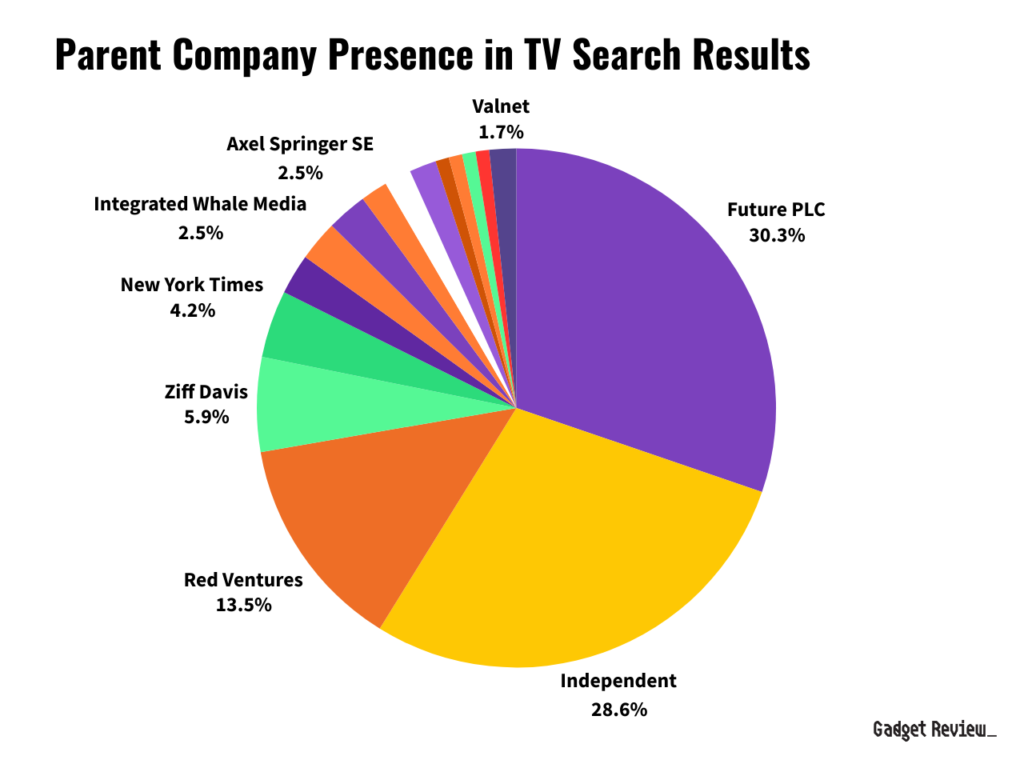
The presence that a reviewer or parent company possesses within the TV keyword SERPs is important because this can translate to the profit these parent companies are raking in. To be frank, the market potential of TV affiliate keywords is enormous–meaning there are millions of dollars at stake here.
The Keywords We Used_
The list of 18 TV keywords includes mostly “best-of” keywords along with best-seller TV model review keywords. If you’re new to these types of keywords, let us explain:
- “Best-Of” Keywords: These are searched by users with transactional intent, helping them compare top product options before purchasing, as seen in searches like “best outdoor TVs.”
- “Review” Keywords: These are searched by users with transactional intent seeking in-depth product reviews before purchasing (example: “Samsung Galaxy S21 review”).
| KEYWORD | TYPE OF KEYWORD | # OF FAKE REVIEWERS ON PAGE 1 | KEYWORD MONTHLY SEARCH VOLUME |
|---|---|---|---|
| best tv | Best-Of | 3/8 | 21,000 |
| best 55 inch tv | Best-Of | 1/6 | 7,800 |
| best oled tv | Best-Of | 1/6 | 7,400 |
| best 4k tv | Best-Of | 1/5 | 7,400 |
| best gaming tv | Best-Of | 2/9 | 4,700 |
| best tv for bright room | Best-Of | 3/7 | 1,600 |
| best tv for sports | Best-Of | 6/10 | 1,100 |
| best samsung tvs | Best-Of | 4/6 | 700 |
| best tvs under 1000 | Best-Of | 3/7 | 500 |
| best tv to use as a monitor | Best-Of | 1/6 | 500 |
| best roku tvs | Best-Of | 2/5 | 350 |
| best 75-inch tv | Best-Of | 3/9 | 300 |
| best cheap tvs | Best-Of | 0/6 | 300 |
| best small tvs | Best-Of | 2/6 | 250 |
| best qled tvs | Best-Of | 0/6 | 250 |
| lg c3 review | Review | 2/7 | 2,400 |
| sony a80k review | Review | 2/5 | 900 |
| samsung s90c review | Review | 1/5 | 350 |
Our Solution To Fix This Problem_
Our commitment, our big “why,” is to expose the fake reviewers and reward the true testers through transparency and cooperation. Too many so-called “reviewers” are nothing but a house of cards. We want to blow them down and give you the tools to make the best choices on the products you want.
Here’s how we score:
- Identify which publications actually test.
- Look for authentic, long-term customer reviews*.
Then, we synthesize the two groups’ scores for products and distill that information down to what really matters so you can make an informed decision with our product True Scores.
Our True Score system revolutionizes product evaluation by combining trusted expert reviews, customer feedback, and advanced AI analysis to provide accurate, unbiased scores of a product’s value and effectiveness. By integrating expert reviews with Trust Ratings and customer insights, the system filters out fake reviews, ensuring only genuine assessments influence the final score.


Cosmic Wonder
Cosmic Wonder

Cosmic Wonder
Cosmic Wonder
Cosmic Wonder

Cosmic Wonder

Cosmic Wonder
Cosmic Wonder
Cosmic Wonder

Absolutely Fresh
Absolutely Fresh

Absolutely Fresh

Absolutely Fresh

Absolutely Fresh
Absolutely Fresh
Absolutely Fresh

Absolutely Fresh
Absolutely Fresh
Absolutely Fresh

Absolutely Fresh
To be transparent, our reviews contain affiliate links so we earn a small commission with each purchase. Here is how we earn money at this current time. However, Gadget Review is on a path to move away from relying only on affiliate commissions, and we’re working on adding a user subscription system.
We understand that our investigation’s findings may rustle some feathers, but this is all for the sake of the consumers. We want to send out the call for every single publication in the industry to strive for transparency and real testing in the landscape of online reviews.
*FYI: Long-term customer reviews are product evaluations provided by customers who have used a product or service for an extended period.Our TV Custom Questions_
The Top 5 Trustworthy TV Reviewers_
Below are your Most Trusted Reviewers for 2024. This goes in order of who earned the highest Trust Ratings for TVs. If they also have “No investors found”, that means they’re a self-funded business that isn’t financially supported by investors.
Publication #1: RTINGs
Trust Rating: 101.40% | Buying Guide Example | Example Review
RTINGS, an independent tech reviewer founded in 2011, sits at the top due to their its rigorous, data-driven analyses, transparent testing processes and more.
Trust Analysis:
- Trust Rating: 101.40%
- Parent Company: Independent / Holding Company: Quebec Inc.
- Type of Reviewer: Niche Tech Review
- Total TV Keywords: 76,663
- How they earn their money: Affiliate programs, Selling products, No investors
- Did they respond to our email?:
Read More
Testing Quality Analysis:
RTINGs undoubtedly tests their TVs. Their comprehensive scoring breakdowns and heavy use of quantitative tests in their reviews (plus willingness to provide proof of them) earn them their high Trust Rating.
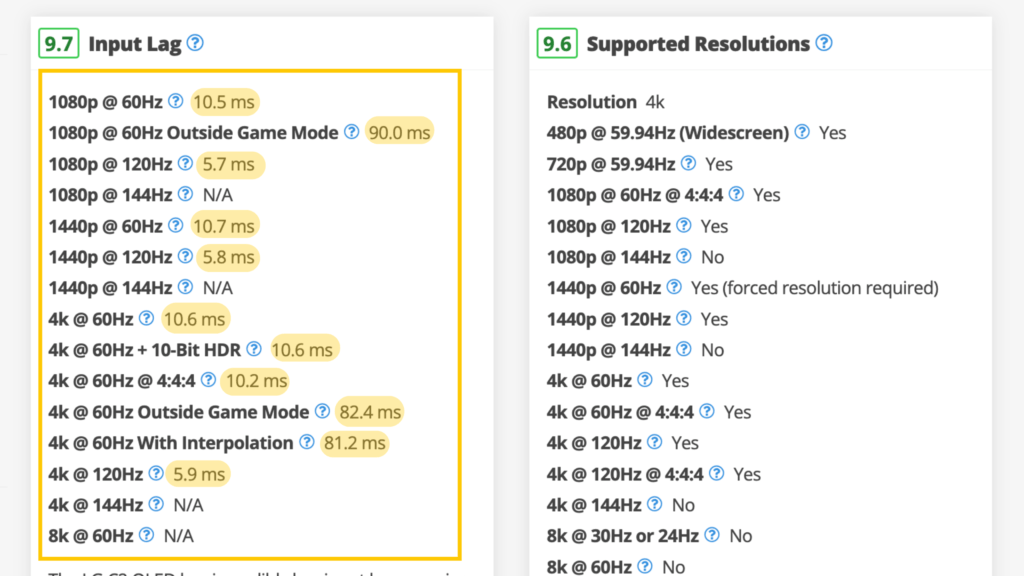
They have elaborate TV testing methodologies for every performance criteria, which is something we’ve never seen done before in the TV review industry. They provide numerous real photos of the TVs and testing equipment, and they use correct units of measurements in their test results.
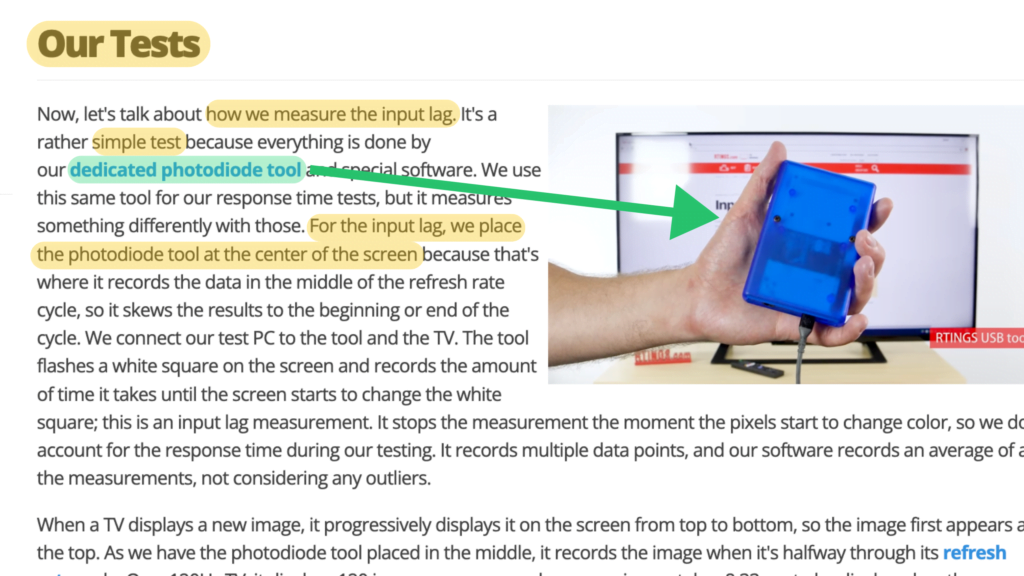
Their video reviews have the reviewers speak in front of the camera as well for further transparency.
Read Less
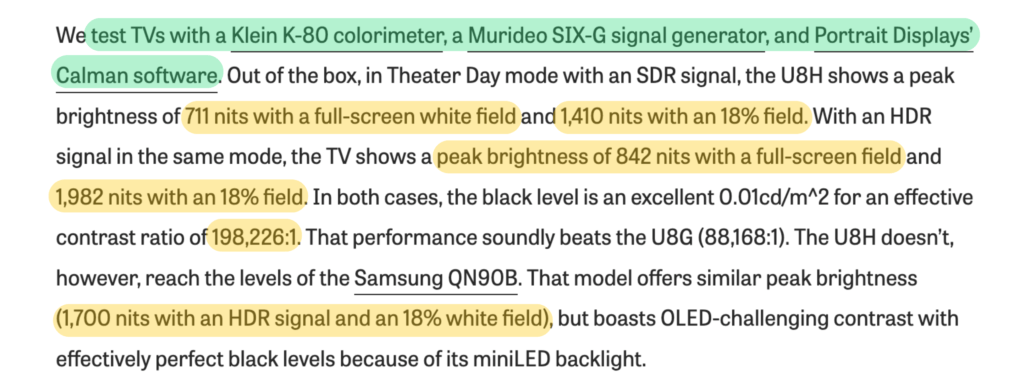
Publication #2: PC Mag
Trust Rating: 91.40% | Buying Guide Example | Example Review
PC Mag, owned by Ziff Davis and founded in 1982, uses a meticulous testing approach that provides detailed quantitative data and clear, unbiased analysis.

Trust Analysis:
- Trust Rating: 91.40%
- Parent Company: Ziff Davis
- Type of Reviewer: Multiple Tech Review
- Total TV Keywords: 103,184
- How they earn their money: Affiliate programs, ads, sponsored posts, paid traffic
- Did they respond to our email?:
Read More
Testing Quality Analysis:
PC Mag engages in proper testing with a clearly defined (though not completely explained) testing methodology that values quantitative testing over qualitative. They test their TVs in a designated testing lab.
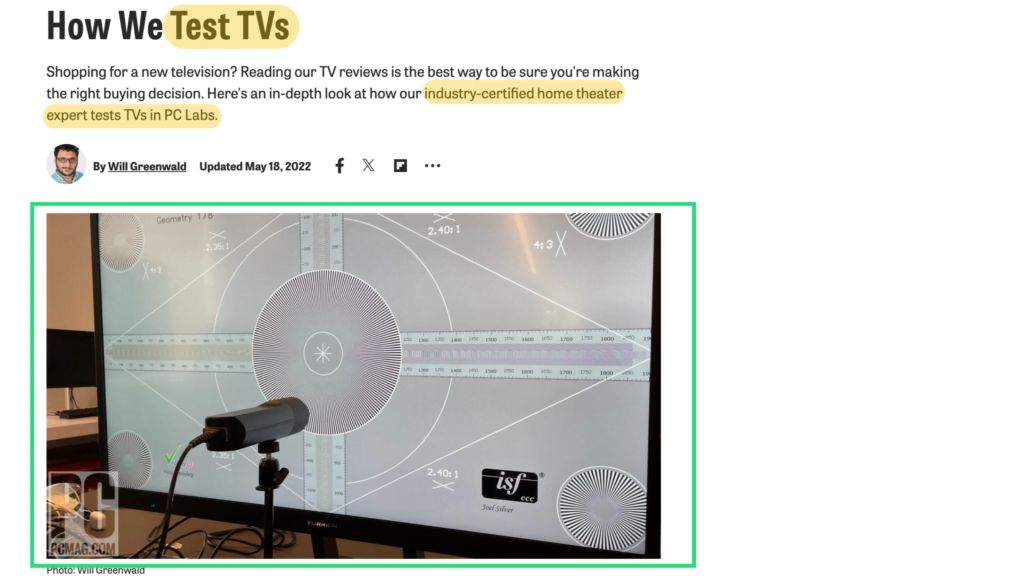
They employ multiple pieces of equipment (by naming them and photographing them too), test every TV they review, and present some of their results within graphs, earning them a high score. They provide test results for all of our custom questions, meaning that they truly know what are the key areas to test on a TV in order to evaluate its performance.
Read Less
Testing Quality Analysis:
PCMag engages in proper testing in their reviews with a clearly defined (though not completely explained) testing methodology that values quantitative testing over qualitative. They employ multiple pieces of equipment, test everything they review, and present their results within graphs such as this color gamut graph, earning them a high score.
They provide test results of all four custom questions we were looking for for the TV review category, so they know what TV performance criteria are most important to evaluate for a consumer.
The only question they missed was a bonus question looking for recently-published video reviews, which can take their excellent reviews even further.
Read Less
Publication #3: CNET
Trust Rating: 89.00% | Buying Guide Example | Example Review
CNET is another trusted publication belonging to Red Ventures which provides extensive expertise and quantitative analyses in their reviews.
Trust Analysis:
- Trust Rating: 89.00%
- Parent Company: Red Ventures
- Type of Reviewer: Multiple Tech Review
- Total TV Keywords: 196,733
- How they earn their money: Affiliate programs, ads, sponsored posts, and paid traffic
- Did they respond to our email?:
Read More
Testing Quality Analysis:
CNET has dedicated testing equipment that it shows off in their reviews, dedicated testing setups (including whole rooms designed to help test TVs) and they provide clear explanations of their performance criteria, testing methods, and scoring breakdowns.
Their support for their testing methodology includes their use of quantitative testing methods, as well as providing pictures and videos of how they test and what they test.

Their comparison tables are great ways of communicating useful information gained through testing for the consumer, while also providing proof you’re doing your due diligence.
Read Less
Publication #4: TFT Central
Trust Rating: 88.63% | Review Example
TFT Central is an independent publication that specializes in detailed, technical tests of computer monitors and TVs and provides their results in a thorough amount of charts.
Trust Analysis:
- Trust Rating: 88.63%
- Parent Company: Independent
- Type of Reviewer: Hyperniche Tech Review
- Total TV Keywords: 512
- How they earn their money: Affiliate programs
- Did they respond to our email?:
Read More
Testing Quality Analysis:
They go in-depth with their lengthy reviews and put a lot of detail. They provide several tables and charts of their test result findings for the TVs, and there are some comparative charts that compare results between various TV and monitor models so users can determine which are the best performers. They also have a testing methodology that explains each area they test and why it’s tested. TFT Central includes a mix of their own real images and software screenshots plus some stock images.
Read Less
Publication #5: Sound and Vision
Trust Rating: 85.20% | Buying Guide Example | Example Review
Founded in 1958 and owned by AVTech Media Americas Inc., Sound and Vision commits to transparency and testing, offering quantitative test data and software screenshots in their TV reviews.
Trust Analysis:
- Trust Rating: 85.20%
- Parent Company: AVTech Media Americas Inc.
- Type of Reviewer: Niche Tech Review
- Total TV Keywords: 7,437
- How they earn their money: Affiliate programs, advertisements, sponsored posts
Read More
Testing Quality Analysis:
They test key test criteria like brightness and color gamut with the proper units of measurement and assign scores out of 5 to Categories of Performance. They document test benches on many of their reviews and provide video review content as well. They provide test software screenshots to further prove their testing claims. Their latest TV reviews tend to have their own real photos, but their older reviews contain stock images.
Read Less
Top 100 TV Trust Ratings Ranked_
Here are the top 100 reviewers for TVs out of the 205 (technically 101 reviewers since #s 100 and 101 earned the same Trust Rating). Keep in mind that only the top 24 of them publish trustworthy, reliable TV reviews, while the majority of them are not trustworthy.
If you’re curious about the entire list of 205 reviewers, what specific guides and product reviews we looked at, and what Trust Ratings they received, here’s the entire list in order of best Trust Ratings to the bottom of the barrel.
The Next Evolution Of This Trust List_
This concludes our Trust List that analyzed the best and worst TV testers and the current climate of the TV review industry.
Our goal was to help you discover a way to spot that fake review, and to follow our lead on the most trusted TV reviewers out there when it comes to purchasing your latest television.
And we’re not finished yet! This Trust List has room to grow, so make sure to check back soon! In the next version, we want to incorporate more actionable opportunities that you, the consumer, can check out. Here’s what’s coming next:
- TV Buying Guides based on the True Scores
- Long-term authentic customer reviews
Assets To Our TV Review Investigation