



You could be rolling through a San Jose corridor right now, completely unaware that a speed safety camera just clocked you. California’s AB 645 pilot is live, enforcement is real, and a red light ticket starts at around $486. There is no single government website listing every active camera statewide. That gap is exactly why Ticket Snipers built its public California Red Light & Speed Camera Map — aggregating locations from city agencies, program disclosures, and two years of actual citation data into one interactive tool.
The Rollout, City by City
San Francisco and Oakland are already delivering results. Los Angeles hasn’t installed a single camera yet.
San Francisco’s numbers are hard to argue with. After one year, SFMTA reported nearly an 80% drop in drivers exceeding the posted limit by 10 mph or more at camera locations — roughly 40,000 fewer daily speeding incidents. Oakland deployed 35 cameras at 18 locations and brought average speeds to near the posted limit within five weeks, per Verra Mobility. Los Angeles, meanwhile, has zero of its 125 planned cameras installed despite earlier July deadlines, with a fall launch now expected.
What the pilot program covers:
- AB 645 (2024) authorized speed cameras in LA, San Francisco, Oakland, San Jose, Glendale, and Long Beach; SB 1297 added Malibu on Pacific Coast Highway
- First two months are warnings only; fines then start at $50 for 11–15 mph over the limit
- Red light camera violations start around $486
- San Francisco’s program, operated by Verra Mobility, covers 33–56 locations
- California Highway Patrol recorded 24,000+ speed-related crashes statewide in 2025, nearly 10,000 involving injuries
“For the last three years, Los Angeles has had more traffic fatalities than homicides.” — Damian Kevitt, Streets Are for Everyone (SAFE)
What the Map Actually Does
When governments don’t build transparency infrastructure, third parties fill the void.
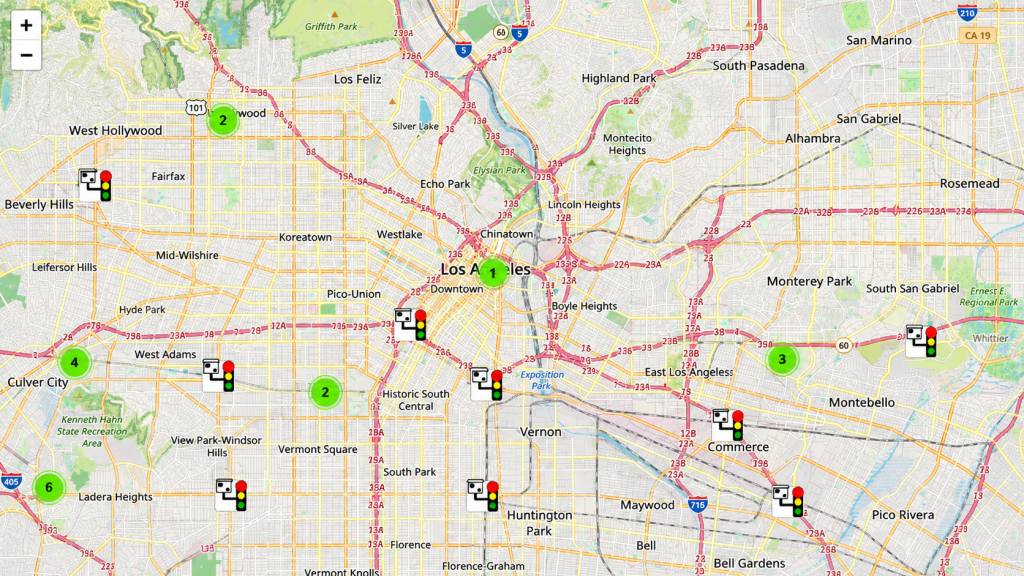
Ticket Snipers’ interactive map lets you zoom into specific cities, click intersections for camera details, spot enforcement clusters, and verify whether the location on your citation belongs to an official program. Community submissions are accepted and reviewed before going live. The map updates continuously as new cameras activate.
LADOT published its 125 planned locations on its own site. Per CBS News reporting, though, no single public registry covers both speed and red light cameras statewide. Third-party tools become de facto public infrastructure when agencies don’t build it themselves — the same logic that made crowd-sourced navigation indispensable now applies to enforcement zones.
If LA’s fall launch arrives on schedule, Southern California’s enforcement landscape shifts quickly. San Francisco and Oakland data suggest cameras genuinely alter driving behavior. Whether your goal is avoiding a $486 ticket or actually slowing down in a high-injury corridor, knowing this map exists gives you a meaningful head start.