



NASA and CNES’s SWOT (Surface Water and Ocean Topography) mission, launched in December 2022, has produced one of the most detailed satellite-derived maps of the global seafloor. The study, “Abyssal marine tectonics from the SWOT mission,” published in Science in December 2024, used approximately one year of observations to generate a marine-gravity field at roughly 8-kilometer spatial resolution, sharper than anything produced by decades of conventional satellite altimetry.
How a Water Satellite Sees Underwater
SWOT never touches the seafloor; it reads what the seafloor does to the ocean above it.
Seamounts and other underwater landforms contain more mass than the surrounding crust, exerting a slightly stronger gravitational pull and creating a barely perceptible rise in the ocean surface above. Think of it like a heavy object under a bedsheet: the sheet reveals the shape without making direct contact.
SWOT’s Ka-band Radar Interferometer measures ocean-surface height across an approximately 120-kilometer-wide swath. The satellite revisits at least 90% of the globe every 21 days, allowing researchers to stack repeated measurements and identify persistent surface-height patterns tied to gravity anomalies below. David Sandwell of the Scripps Institution of Oceanography, a co-author of the study, described the result as “a huge jump in our ability to map the seafloor.”
What the Map Reveals
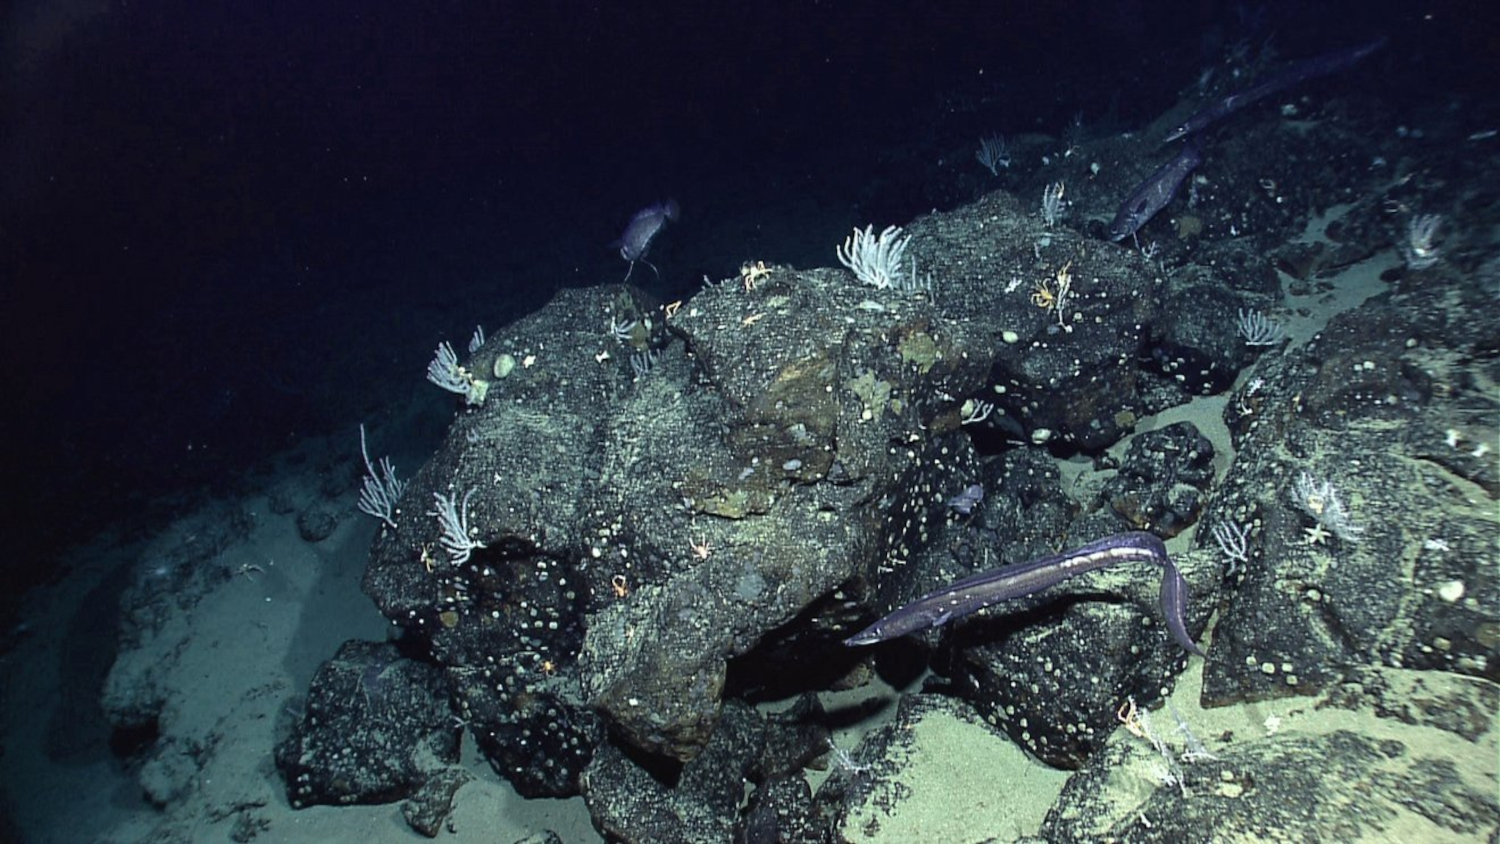
Tens of thousands of seafloor features were hiding in plain sight, beneath kilometers of water.
Earlier satellite altimetry systems generally detected seamounts taller than roughly one kilometer. SWOT can detect seamounts approximately 450 meters high and about 4 kilometers across. NASA reports the improved data could raise the number of known seamounts from roughly 44,000 to as many as 100,000.
The Science study also identified more than 200,000 previously unrecognized abyssal hills and other small structures, according to Science news coverage of the research. Lead author Yao Yu, a Scripps oceanographer, noted that abyssal hills are “the most abundant landform on Earth,” covering about 70% of the ocean floor. Their parallel orientations record how tectonic plates spread apart over millions of years, preserving a record of plate motion beneath the deep ocean.
Why It Matters Beyond the Map
Better seafloor charts carry practical consequences for navigation, submarine cables, currents, and climate science.
Accurate seafloor maps reduce uncertainty for submarine communications cable routes, inform shipping-route planning, and support marine-hazard detection. Nadya Vinogradova Shiffer of NASA identified navigation, mineral exploration, hazard detection, and seabed operations as areas where better seafloor data carries direct consequence. Seabed mining and defense applications represent potential future uses; the current study does not confirm those outcomes directly.
Abyssal hills and other topographic features steer deep currents, influence heat transport, and redistribute nutrients that support marine ecosystems. Understanding that terrain more precisely can improve ocean-circulation models and the processes that connect the seafloor to the surface.
Ship-based multibeam sonar remains the more precise tool for local depth measurement. Only about 25% of the ocean floor has been directly surveyed by ship-based sonar. The international scientific community has targeted complete coverage by 2030, a goal ship surveys alone cannot meet. SWOT helps close that gap without replacing the ships.
Additional years of SWOT data are expected to reduce noise and sharpen the maps further. If you follow submarine infrastructure, ocean science, or navigation technology, this mission is filling in an outline that has been incomplete for decades.