



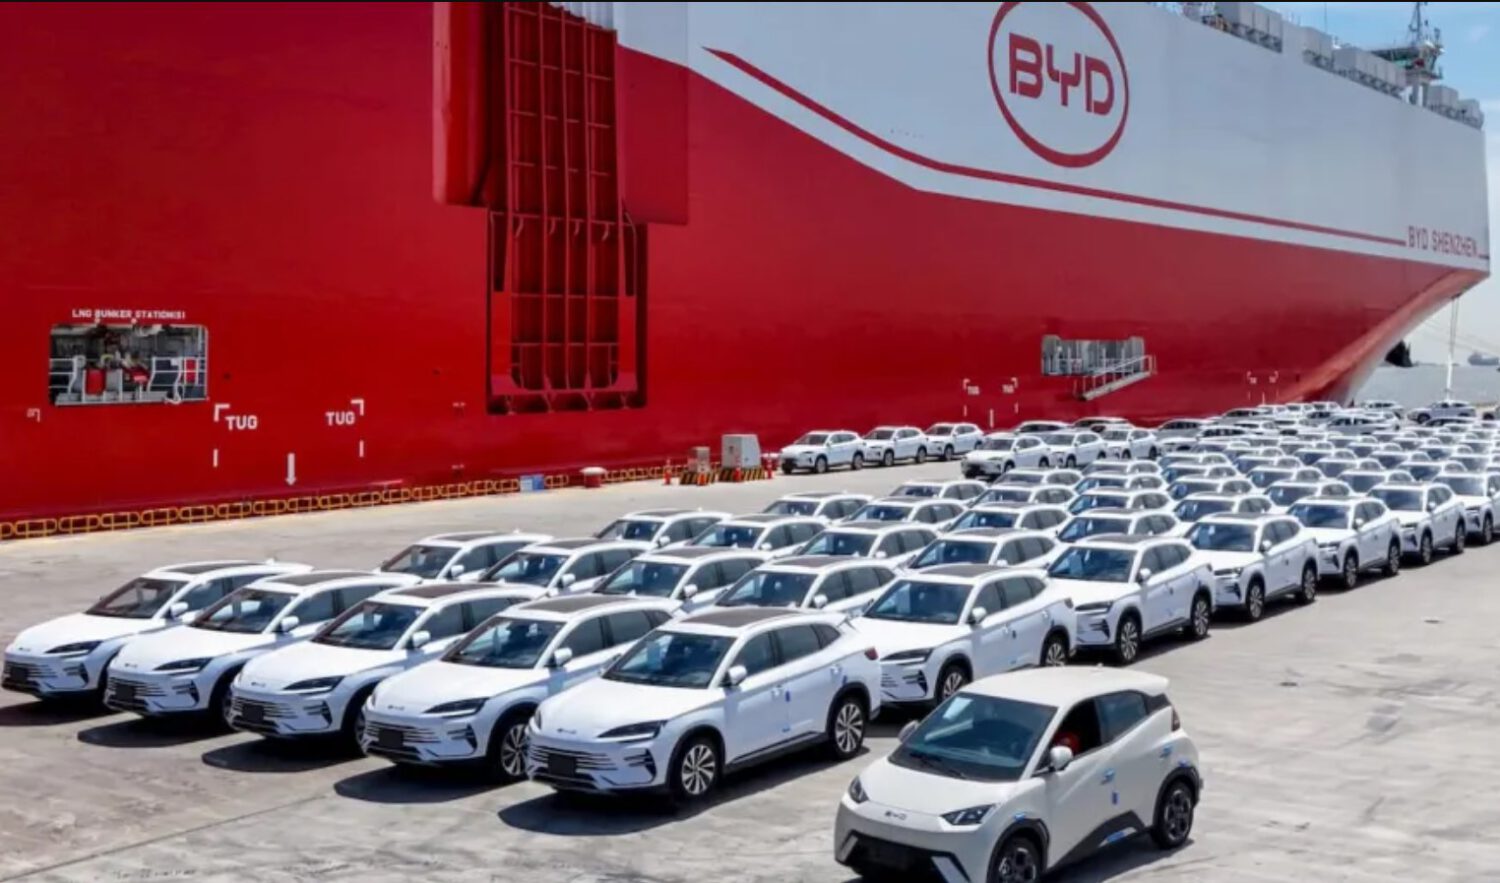
BYD sold 305,743 battery-electric passenger electric vehicles in October 2026, according to CNEVPost, a 37.4% increase from October 2025 and 11.9% above September’s figure. No prior month in the company’s history had crossed 300,000 battery-electric passenger vehicles, and October marked the third consecutive monthly record.
Putting the Number in Perspective
The comparison is not a like-for-like measure, but it illustrates a gap in reported sales volume that is difficult to ignore.
Kelley Blue Book and Cox Automotive Insights estimated that 262,649 electric vehicles were sold across all U.S. brands during the third quarter of 2026, covering July through September. BYD’s October figure alone exceeded that total by roughly 43,000 vehicles, or about 16%. That contrast covers one manufacturer’s global battery-electric passenger-vehicle sales in one month against an entire national market’s sales across three months; it functions as a scale illustration, not a direct competitive comparison.
The Mix Shift Inside the Numbers
Battery-electric vehicles rose to nearly two-thirds of BYD’s passenger-vehicle sales as plug-in hybrid volumes contracted year over year.
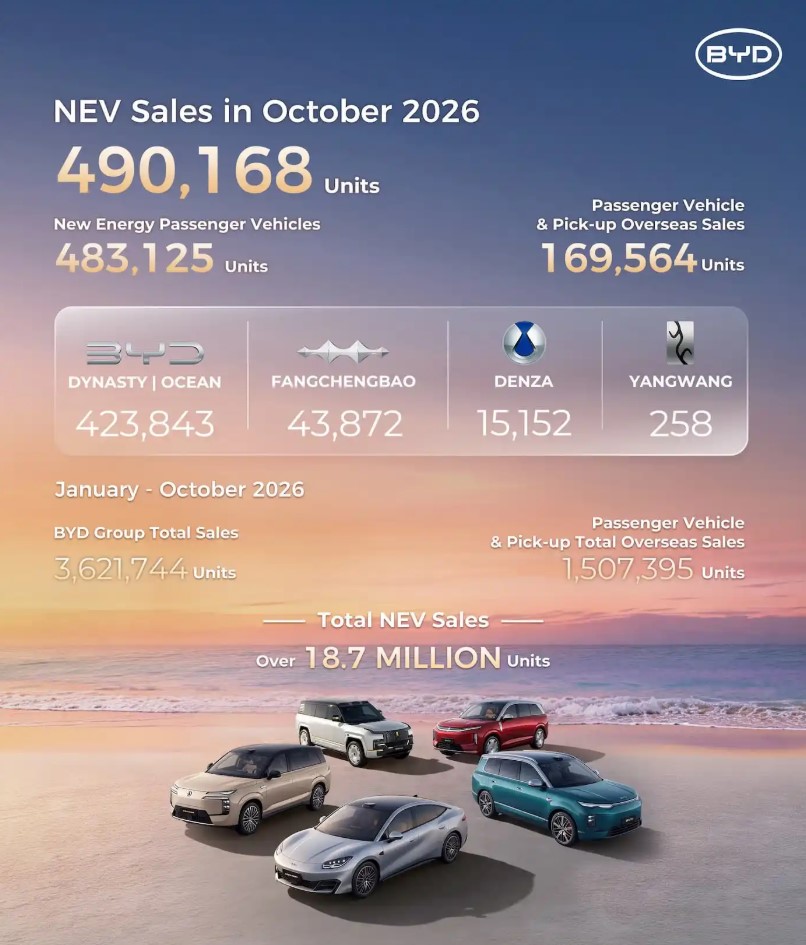
BYD’s total new-energy vehicle sales, including plug-in hybrids and commercial vehicles, reached 490,168 in October, up 11% year over year. BEVs accounted for 63.3% of passenger-vehicle sales, up from 50.9% a year earlier. Plug-in hybrid passenger sales fell 17.2% year over year to 177,382 units, though whether that reflects shifting consumer behavior, a stronger BEV lineup, or deliberate portfolio choices is not clear from the available data.
Growth Beyond China’s Borders
Export volume underscores that BYD’s record reported sales are not solely a product of its large domestic market.
BYD exported 170,194 vehicles in October, with shipments reaching markets in Europe, Southeast Asia, and Central and South America. That figure, up sharply year over year according to CNEVPost, signals that international expansion is contributing meaningfully alongside domestic demand.
What the Comparison Does and Does Not Mean
U.S. EV sales in Q3 2026 were affected by the expiration of federal incentives, which complicates direct year-over-year reads.
The expiration of federal EV purchase incentives made U.S. quarterly sales figures particularly sensitive to policy timing, according to Cox Automotive. Cox noted that buyers rushed to use expiring incentives in Q3 2025, creating an unusually strong comparison period that depressed Q3 2026 results by 39.5% year over year. That context matters when drawing conclusions from the gap between BYD’s monthly total and the American market’s quarterly figure, a landscape also shaped by developments like the Tesla Robotaxi program pushing the broader EV industry forward.
The Structural Gap
The distance between BYD’s monthly figure and U.S. quarterly sales reflects differences in market size, model breadth, and supply chain maturity.
The number does not mean BYD has overtaken the U.S. auto industry. It does mean that one Chinese automaker’s reported monthly battery-electric passenger-vehicle sales now exceed the entire U.S. market’s quarterly EV total, a comparison that speaks to the difference in scale between the two markets , much as consumers navigating that market are increasingly scrutinizing what a car probably costs to own and maintain.