



Where you live shapes your EV experience more than the car you drive. A 2026 iSeeCars study using U.S. Department of Energy Alternative Fuels Data Center data finds that charging access across American metro areas and states remains deeply uneven, and the gap between the best and worst markets is substantial.
The more useful measure is residents per charger, not total charger count. Population-adjusted density reflects how many people are competing for each available unit, which is what actually determines day-to-day access.
Who Leads and Who Lags on EV Charging Access
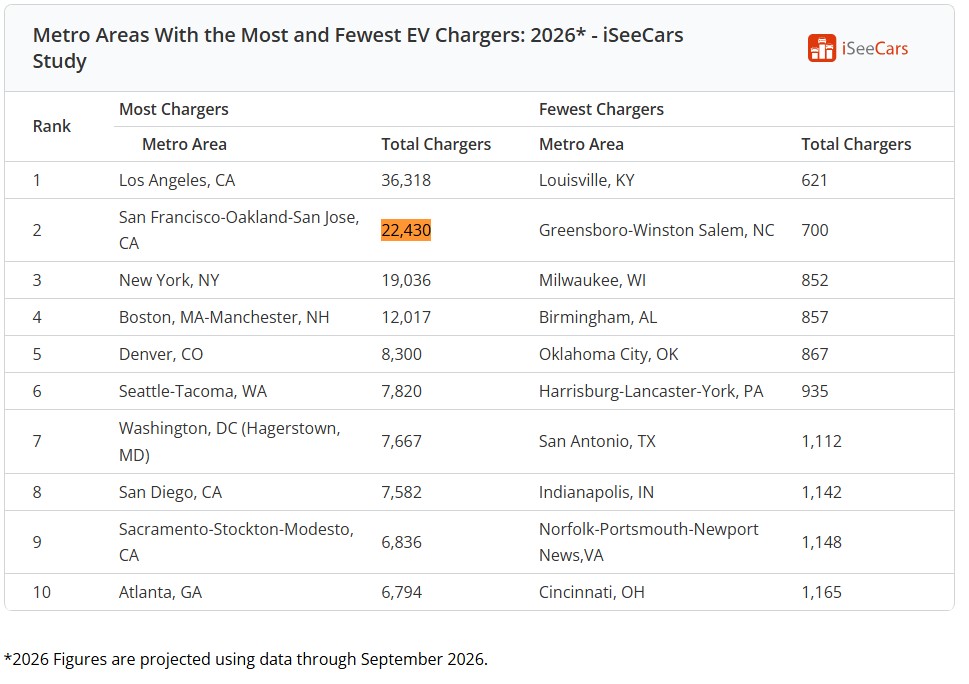
San Francisco tops the metro rankings on access per resident, while Los Angeles holds the most total chargers, and Louisville sits at the bottom of both lists.
San Francisco-Oakland-San Jose is the most EV-friendly major metro in the country, with 334 residents per charger and 22,430 total chargers, according to the iSeeCars study. Los Angeles has more chargers than any other metro at 36,318, but a larger population pulls its density ranking down considerably.
More chargers in a bigger city is not the same thing as easier access. That distinction matters for your experience as a driver.
Louisville, Kentucky sits at the opposite end of the spectrum, with just 621 total chargers and 2,904 residents per charger. Greensboro-Winston-Salem, Milwaukee, and Birmingham round out the weakest metros, all below 900 total chargers.
At the state level, Vermont leads the country at 450 residents per charger. Its low population improves the ratio, though the ranking also depends on the number and type of chargers included in the study.
California ranks second at 480 residents per charger. The state also holds the most total chargers nationally at 81,932, more than one quarter of the entire U.S. count in the study. Massachusetts comes in third at 539 residents per charger.
Alaska anchors the bottom with just 227 total chargers statewide, followed by North Dakota at 288 and South Dakota at 345.
Growth Is Slowing. Placement Now Matters More Than Volume.
National charger growth is projected to hit a 14-year low in 2026, putting more pressure on where new infrastructure actually lands.
National charger infrastructure is still expanding, but 2026’s projected growth rate of 15.5% is the slowest annual rate in 14 years, according to iSeeCars. According to the study, iSeeCars executive analyst Karl Brauer noted that location remains a major factor in access as the network’s pace of expansion has slowed substantially.
Minneapolis-St. Paul projects the largest metro improvement at 22.5% from 2025 to 2026. New Jersey leads all states with a projected 22.2% improvement in charger access.
For context, U.S. public charging ports grew from 5,070 in 2011 to 184,098 in 2023, according to Department of Energy Alternative Fuels Data Center data. That long-run growth is notable; the recent deceleration is worth monitoring.
A few caveats apply. The rankings measure availability only, not reliability, uptime, pricing, or queue times. The study covers Level 2 and Level 3/DC fast chargers, and its 2026 figures are projections through September, not final counts. Metro-boundary definitions and population estimates also affect how residents-per-charger comparisons shake out.
Slower growth puts a premium on where new chargers are placed rather than on national totals alone. If you are weighing an EV purchase or a move, the residents-per-charger figure gives you a clearer picture of local access than a raw count of plugs in the ground.