



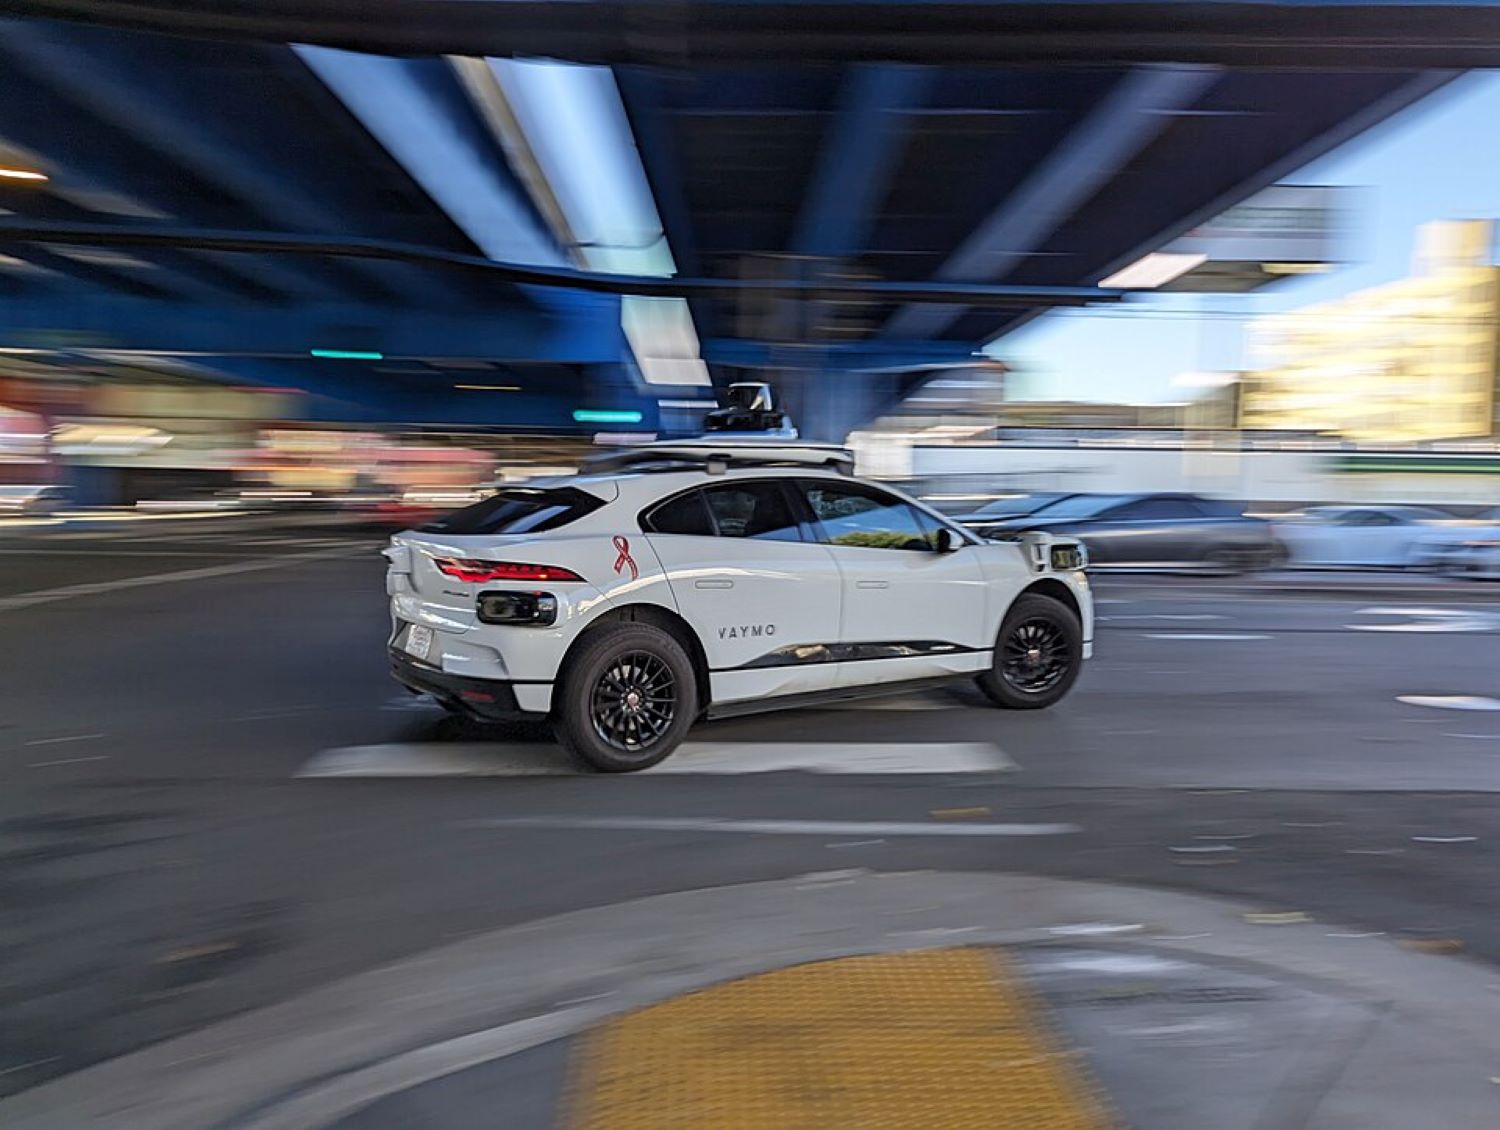
Alphabet’s driverless cars finally have independent receipts. The Insurance Institute for Highway Safety — the same nonprofit that crash-tests your sedan — analyzed roughly 50 million autonomous miles across Phoenix, San Francisco, Los Angeles, and Austin from 2021 to 2024. The finding: Waymo’s Level 4 robotaxis recorded 1.28 police-reportable crashes per million miles versus 4.06 for human drivers in the same cities and timeframe. That’s a 68% lower crash rate, and it comes from an organization with no stake in Waymo’s success.
The numbers behind the headline are striking:
- Single-vehicle crashes dropped 85% per mile traveled
- Injury crashes fell 81%
- Phoenix led city-by-city at 76% fewer crashes
- Los Angeles followed at 71%
- San Francisco came in at 35%
Across all four cities, Waymo was involved in 89 police-reportable crashes versus 901,525 human-involved crashes over the same period — a gap that’s hard to dismiss. IIHS described the results as a “substantial safety benefit” compared with human drivers.
Austin logged a 4% higher crash rate than human drivers — a reminder that thin data samples from limited testing mileage can flip the headline entirely.
The Fine Print You Actually Need to Read
Favorable operating conditions and reporting quirks shape the headline number more than you might expect.
Those 50 million miles came with important context. Waymo must report every minor contact to NHTSA; most human drivers don’t call the police after a low-speed fender-bender. So IIHS stripped out minor AV incidents and compared only crashes serious enough that a typical driver would file a police report — a smart methodological choice that still means the comparison isn’t perfectly symmetrical. About half of Waymo’s crashes occurred on roads with speed limits below 25 mph, compared to just 8% for human crashes in those same cities. Lower speed means lower severity. The human benchmark also includes every impaired, fatigued, and distracted driver on the road — not exclusively attentive ones.
Nearly half of Waymo’s miles were driven with zero passengers onboard, which naturally reduces occupant injury risk but raises separate questions about traffic impact from repositioning vehicles.
Not Perfect – Just Better
Hundreds of reported incidents and an unexplained nighttime pattern keep this story honest.
While Waymo’s system is demonstrably safer than average, it is far from infallible. Federal crash data shows Waymo has logged hundreds of NHTSA-reported incidents overall, including at least two fatalities — context that matters when evaluating any safety claim. More puzzling: Waymo vehicles showed a higher proportion of crashes in dark conditions than human drivers, despite running LiDAR and radar systems that operate independently of visible light. IIHS flagged the pattern without a definitive explanation. Think of it like noise-canceling headphones that somehow still let through the one sound you needed blocked — the technology outperforms overall, but specific failure modes remain genuinely surprising.
What this study actually shifts is the question regulators and riders are asking. The debate moves from “are robotaxis safe?” to something harder and more useful: safe enough, under what conditions, and for whom? Independent data like this is what cities and policymakers will lean on as they decide how far and how fast to expand driverless services. Understanding what car really costs — whether gas, diesel, or electric — remains a parallel consideration for consumers weighing their transportation options.