





The AI revolution has arrived in trading, and the tools have matured from experimental gadgets into operational necessities. Traders now deploy models like Claude to generate custom Pine Script indicators and analyze market data at institutional speed. These curated tools cut through market chatter, offering strategic insights that reshape how retail participants compete. The selections below deliver tangible outcomes across analysis, execution, and risk management, moving beyond theoretical promise into practical edge.
16. Claude (Anthropic AI Model)
This large language model transforms raw trading data into coaching-level feedback, from Pine Script generation to equity curve projections.
Claude from Anthropic operates as both a technical assistant and strategic advisor for trading workflows. Available through Claude.ai in free and paid tiers, this large language model family handles text and code generation, analysis, and multi-step reasoning tasks. Paid versions add higher message limits and Claude Code tools, which support complex automation workflows.
The practical applications span pre-market preparation through post-session review. Claude summarizes breaking news from multiple sources, generates custom TradingView Pine Script indicators on demand, and analyzes trade screenshots to identify setup patterns. For performance analysis, it processes CSV trade logs to compute win rates, average win/loss ratios, and reward-to-risk metrics. Monte Carlo simulations run hypothetical 1,000-trade sequences using historical statistics, showing best-case and worst-case equity paths from a given starting balance. The model also compares proprietary firm rules, helping traders select evaluation accounts that match their style and risk tolerance. Traders gain research depth and execution speed previously reserved for institutional desks, compressing hours of manual work into minutes.
15. TradingView

This cloud-based platform consolidates charting, scripting, and backtesting for stocks, futures, forex, and crypto in one interface.
TradingView delivers an integrated environment for multi-asset analysis and strategy development. The cloud-based platform covers stocks, futures, forex, and cryptocurrency markets, eliminating the need to juggle separate tools. Native features include performance reports, real-time price alerts, and strategy backtesting, allowing traders to validate ideas before risking capital.
The platform integrates Pine Script directly through the Pine Editor, enabling custom indicator and strategy creation without external compilers. Built-in tools include VWAP indicators with standard deviation bands, which many intraday traders use to identify overbought and oversold zones. Community scripts extend functionality further, offering thousands of shared indicators and strategies. TradingView operates server-side, handling execution and rendering without local hardware demands. For traders managing multiple markets or building rule-based systems, the platform provides the infrastructure to test, refine, and deploy strategies from a single workspace.
14. Pine Script (TradingView’s Scripting Language)
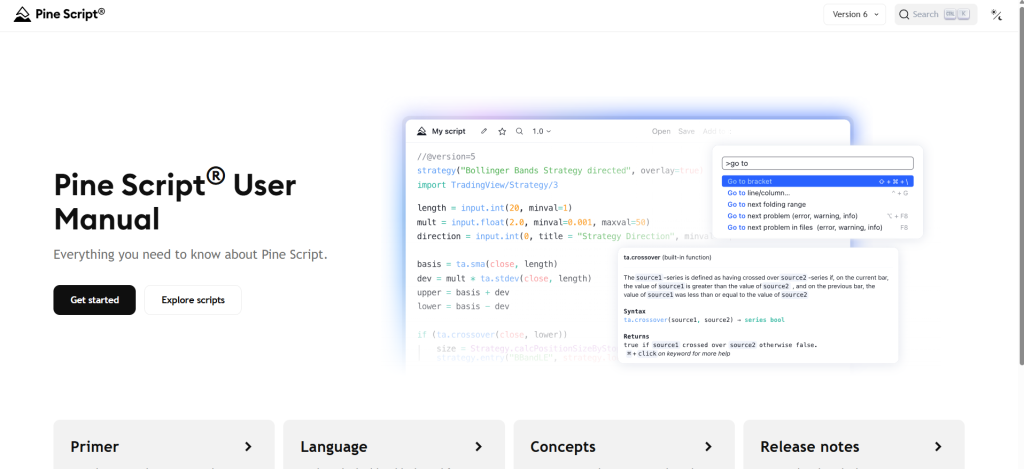
TradingView’s domain-specific language makes custom indicator and strategy development accessible without deep programming expertise.
Pine Script removes the traditional barrier between trading ideas and executable code. This domain-specific language, built exclusively for TradingView, allows traders to create custom indicators and backtestable strategies with straightforward syntax. Current versions (v4 and v5) support time series operations, drawing objects on charts, and essential strategy functions such as strategy.entry and strategy.exit for automated entry and exit logic.
The server-side execution model eliminates local compilation and dependency management. Traders commonly use Pine Script for VWAP-based indicators, standard deviation bands, and rule-based setups such as mean reversion or breakout systems. Scripts can be saved, shared publicly via the TradingView library, or kept private for personal use. The language translates market logic directly into visual overlays and backtestable strategies, letting traders iterate on ideas without wrestling with general-purpose programming languages or external APIs.
13. VWAP (Volume Weighted Average Price)
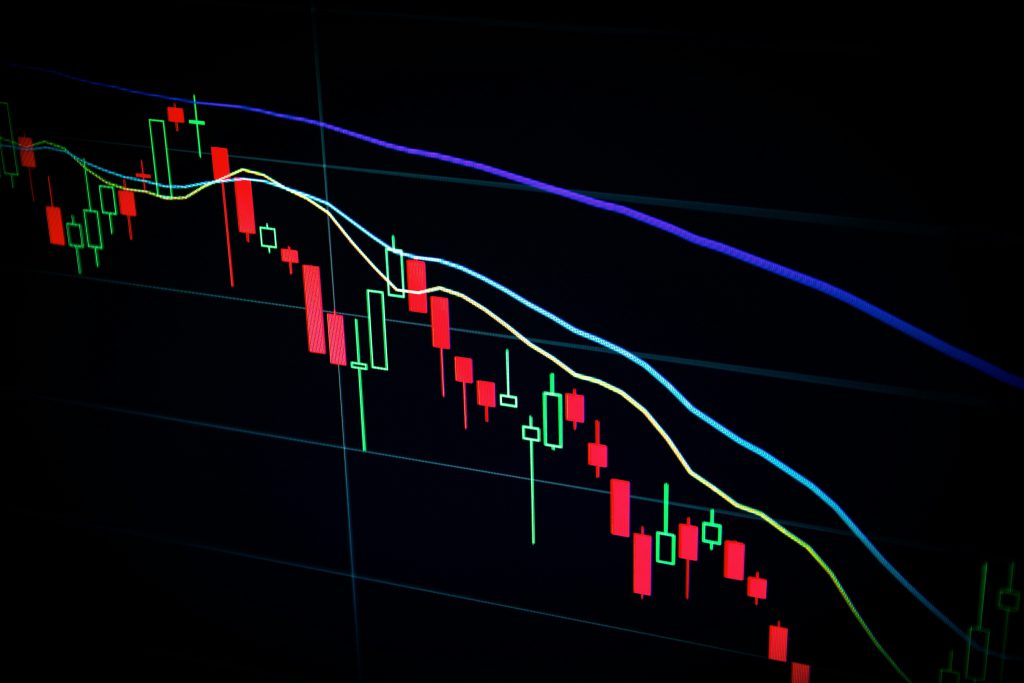
This volume-weighted metric provides a dynamic fair-value reference and forms the foundation for probability-based band strategies.
The Volume Weighted Average Price calculates by summing price multiplied by volume, then dividing by total volume traded. Session-anchored VWAP resets at the start of each trading session, giving intraday traders a fresh reference point. The metric functions as both a support or resistance level and a benchmark for fair value, showing where the majority of volume has transacted.
Overlaying standard deviation bands around VWAP creates probability zones that help identify price extremes. These bands act like statistical guardrails, showing when price has stretched beyond typical ranges. Traders use the zones for mean reversion setups, looking for bounces off outer bands or VWAP reclaims that signal momentum shifts. Breakouts beyond bands with accompanying high volume often indicate sustained moves rather than noise. The combination of VWAP and deviation bands turns volume-weighted data into actionable entry and exit signals, grounding decisions in statistical likelihood rather than discretionary guesswork.
12. VWAP Standard Deviation Bands Indicator (TradingView)
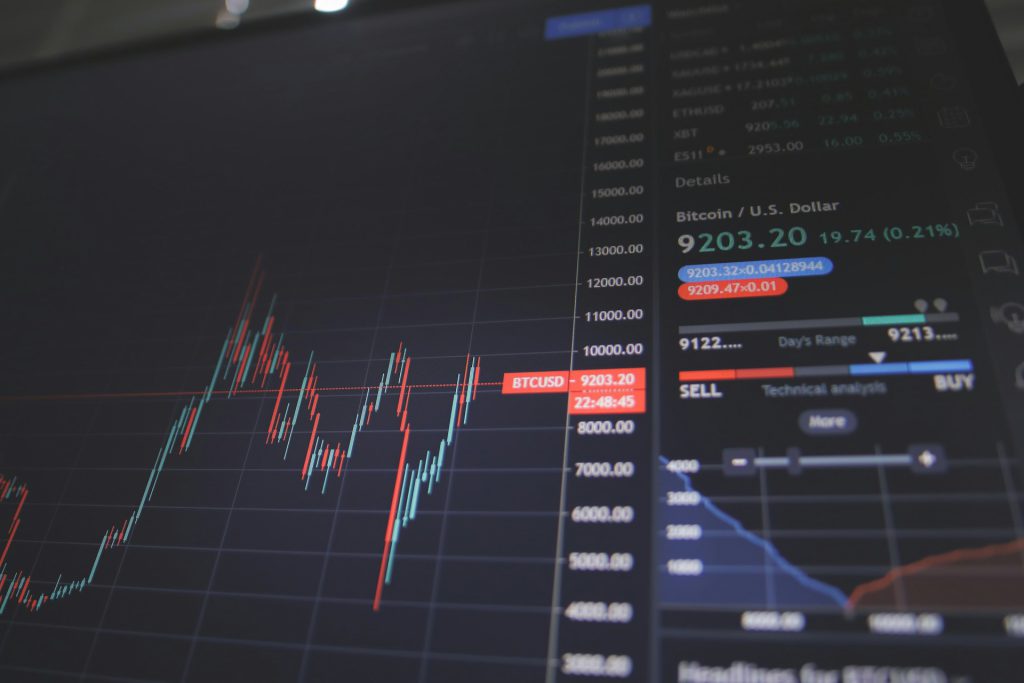
This Pine Script indicator plots five pairs of standard deviation bands around VWAP, creating dynamic probability zones for intraday setups.
The VWAP Standard Deviation Bands v2 indicator plots VWAP with five pairs of bands at approximately ±1.28, ±2.01, ±2.51, ±3.09, and ±4.01 standard deviations. These bands create volume-based probability zones, with inner bands capturing typical price action and outer bands marking statistically stretched areas. The indicator is implemented in Pine Script and added to charts through the Pine Editor by pasting code, saving, and selecting “Add to Chart.”
Traders use the bands for mean reversion strategies, entering when price reaches outer bands and exiting near VWAP or the opposite band. The bands also define dynamic support and resistance levels, adjusting throughout the session as volume accumulates. For overbought/oversold assessment, price beyond the ±2.51 or ±3.09 bands signals potential exhaustion, while closes inside the ±1.28 range indicate consolidation. The indicator provides structure for intraday risk management, letting traders define precise stop and target zones relative to statistically significant levels rather than arbitrary price points.
11. Forex Factory (Economic Calendar)

This widely used calendar flags high-impact macroeconomic events with visual markers, helping traders plan around scheduled volatility.
Forex Factory operates as a comprehensive economic calendar for forex and macroeconomic data releases. The platform categorizes events by expected impact, using visual flags to highlight critical releases. Red folders mark high-impact events such as CPI reports, employment data, central bank decisions, and major sentiment surveys, while lower-impact items receive less prominent markers.
The calendar structure allows traders to scan the day’s or week’s scheduled events quickly, identifying periods of potential volatility. Intraday traders use this information to either position for expected moves or avoid trading entirely during major announcements. The visual categorization streamlines pre-market preparation, turning raw economic schedules into actionable risk awareness. For traders sensitive to macro catalysts, Forex Factory serves as an early warning system, ensuring scheduled data doesn’t catch positions off guard.
10. Financial Juice (Breaking Headlines Service)
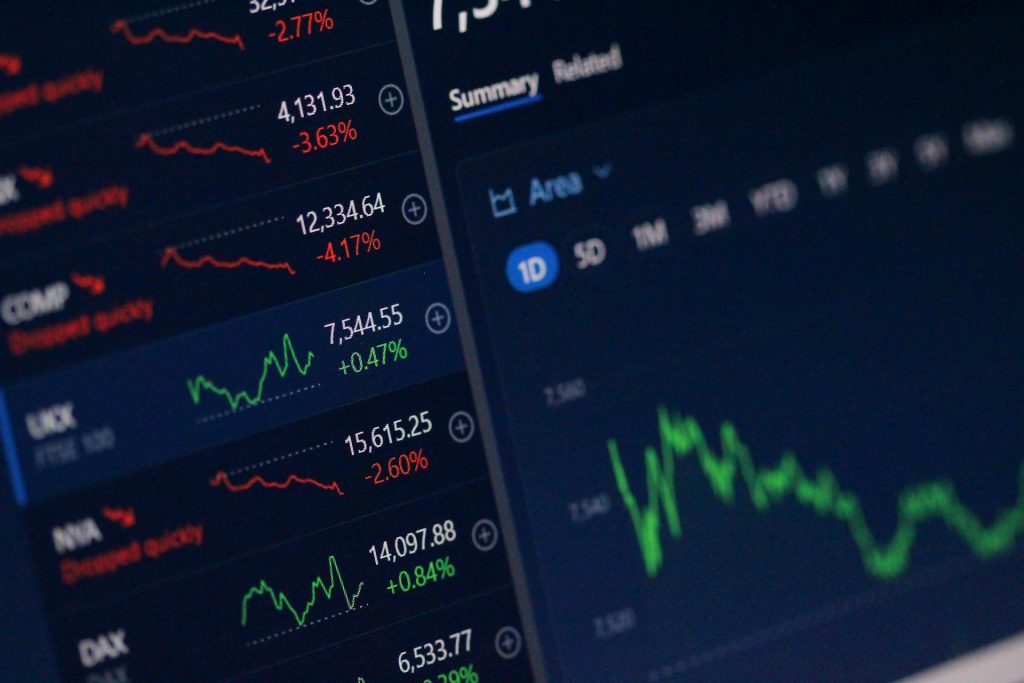
This real-time news platform delivers short headline-style updates across macro, equities, commodities, and geopolitics for fast intraday decisions.
Financial Juice aggregates breaking financial news into concise, real-time headlines. The platform covers macroeconomic developments, equity-specific catalysts, commodity moves, and geopolitical events, providing the breadth day traders need to track sentiment shifts. Updates arrive in short headline format, optimized for quick scanning and immediate reaction rather than deep analysis.
The speed advantage matters for intraday strategies, where price can move on unscheduled news before broader market participants react. Many traders pair Financial Juice with an economic calendar such as Forex Factory, covering both scheduled data releases and surprise headlines. This combination creates a comprehensive news workflow, reducing the risk of missing catalysts that could invalidate technical setups or create sudden opportunities. For traders who rely on timely information to manage risk or capitalize on volatility, Financial Juice delivers the raw material for fast, informed decisions.
9. ChatGPT (OpenAI AI Model)

OpenAI’s conversational AI system, especially in paid tiers, offers strong reasoning and image analysis for coding, news summarization, and trade log review.
ChatGPT from OpenAI provides conversational AI capabilities across a range of trading tasks. Paid tiers like ChatGPT Plus unlock more capable models with improved reasoning and larger context windows. These versions handle complex chart screenshot analysis with greater precision than free alternatives, often delivering nuanced observations on price action, volume patterns, and indicator alignment.
The model codes custom TradingView Pine Script indicators, summarizes dense financial news into actionable bullet points, and reviews CSV trade logs to identify performance patterns. For example, uploading a trade history file allows ChatGPT to compute win rate, average win/loss, and reward-to-risk ratios, then highlight behavioral patterns such as overtrading countertrend setups or inconsistent position sizing. The paid versions deliver analytical depth that supports tactical decision-making, moving beyond basic chat into structured feedback loops for strategy refinement.
8. Apex Trader Funding (Proprietary Trading Firm)

This futures prop firm offers evaluation accounts with no minimum trading days but has attracted criticism over reported payout inconsistencies.
Apex Trader Funding provides futures evaluation accounts starting at nominal sizes such as $50,000, requiring traders to hit profit targets while adhering to strict risk rules. Typical parameters include daily loss limits around $1,000, trailing end-of-day drawdown thresholds, and position limits. Many evaluation plans impose a 30-day completion window but allow passing in a single session with no minimum trading days, creating flexible timelines for capable traders.
After passing evaluation, funded “Performance Accounts” offer profit splits up to 100% and the option to run multiple accounts simultaneously. However, trader reports have raised concerns about payout processing and account terminations, with some users describing denials after meeting stated criteria. These inconsistencies create uncertainty around the firm’s reliability. Traders considering Apex should weigh the accessible entry costs and flexible evaluation structure against the reported operational friction in payout execution.
7. Take Profit Trader (Proprietary Trading Firm)
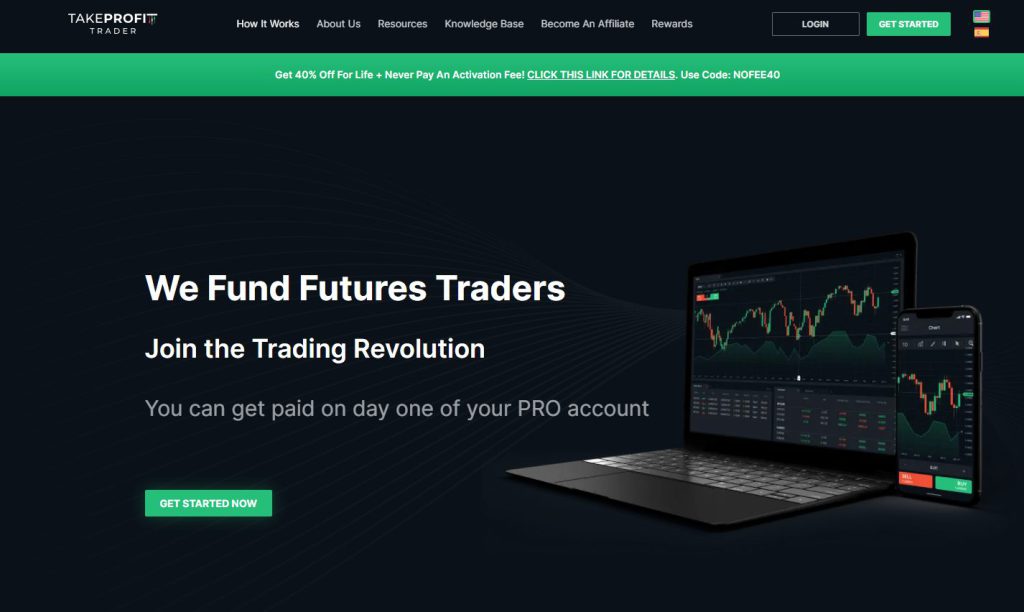
This futures prop firm emphasizes fast payout processing and straightforward fee structures, rewarding disciplined intraday risk management.
Take Profit Trader distinguishes itself through rapid payout processing, with many traders reporting same-day fulfillment once conditions are met. The firm also offers simpler fee structures compared to competitors, reducing hidden costs and administrative friction. Evaluation accounts enforce strict intraday drawdown and risk controls, favoring traders who manage position sizing and stop placement with precision.
The firm’s operational model rewards consistent, disciplined execution over large swings. Traders who thrive under clear boundaries and value quick access to profits find TPT’s approach aligned with controlled, repeatable strategies. The emphasis on tight risk parameters acts as a filter, attracting participants who prioritize risk management over aggressive scaling. For traders seeking operational efficiency and transparent rules, TPT delivers a streamlined path from evaluation to funded account.
6. MNQ (Micro E-mini Nasdaq-100 Futures Contract)

This CME-listed micro contract tracks the Nasdaq-100 at 1/10 the size of NQ, offering lower margin and nearly 24-hour trading access.
The MNQ is the Micro E-mini Nasdaq-100 futures contract listed on the Chicago Mercantile Exchange. At 1/10 the size of the standard NQ contract, it reduces both required margin and tick value, making Nasdaq-100 exposure accessible to retail and prop traders managing smaller accounts. The smaller contract size allows more granular risk control, letting traders scale positions incrementally without committing to full NQ contracts.
The MNQ trades nearly 24 hours daily, from Sunday evening through Friday, with typical Globex hours running approximately 6:00 p.m. to 5:00 p.m. ET. This extended availability gives traders flexibility to react to global market developments without waiting for regular session opens. For participants targeting the tech-heavy Nasdaq-100 index with precise position sizing and round-the-clock access, MNQ provides the necessary infrastructure.
5. Prop Trading Firms (General Concept)
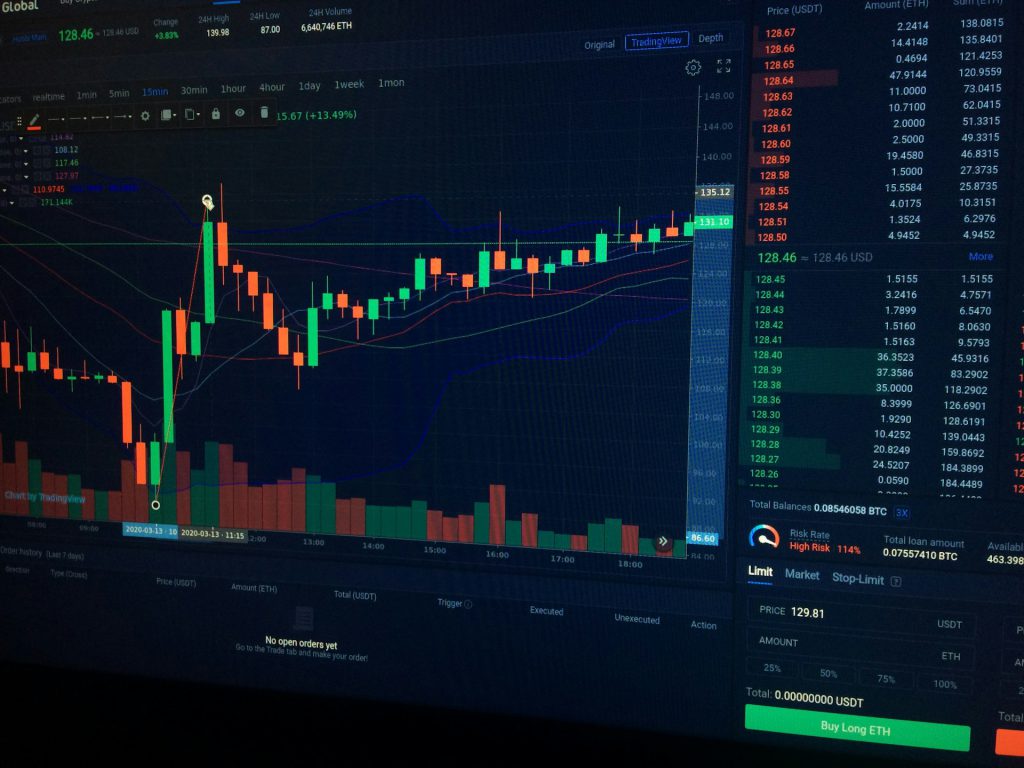
These firms allocate capital to traders who pass evaluations, retaining 75–100% of profits under strict risk rules that vary widely by firm.
Proprietary trading firms allocate firm capital to traders who demonstrate profitability and risk discipline through evaluation phases. These evaluations require hitting profit targets on simulated accounts while adhering to drawdown limits, daily loss caps, and position restrictions. Passing the evaluation unlocks a funded account where traders typically retain 75–100% of generated profits.
Firm rules vary significantly, covering static versus trailing drawdown, intraday versus end-of-day risk assessment, payout schedules, and instrument restrictions. Missing compliance details such as flattening positions by end-of-day cutoffs can result in account termination, forcing traders to restart the evaluation process. AI tools like Claude now help traders compare firm policies systematically, identifying rule sets that match their strategy and risk tolerance. For traders without substantial personal capital, prop firms offer a viable path to scaled trading, contingent on navigating the specific operational framework each firm enforces.
4. Apex Trader Funding Performance Report / CSV
Trade logs exported as CSV files enable AI tools to compute statistics and identify performance patterns, turning raw data into coaching-level feedback.
Performance CSV files from trading platforms contain trade-by-trade data including entry/exit times, direction (long/short), size, profit/loss, and duration. Uploading these structured files to AI tools such as Claude Code transforms spreadsheet rows into actionable metrics: win rate, average win and loss size, reward-to-risk ratio, and behavioral patterns.
Even short sessions yield diagnostic value. For example, a 21-minute session with multiple trades can reveal tendencies such as overtrading countertrend setups or inconsistent stop placement. AI analysis might show that 63% win rate came with an average win of $77 versus average loss of $51, suggesting a positive but narrow edge. The tools also flag patterns like better performance on long versus short trades, or deteriorating results after a losing streak. This coaching-style feedback refines strategy execution, replacing guesswork with data-driven adjustments that directly target weaknesses.
3. Order Blocks / Supply and Demand Zones
These price zones, often marked as gray boxes, identify institutional order flow areas and combine with VWAP bands for nuanced entry and stop rules.
Order blocks represent price zones where institutional participants are believed to have placed large orders, creating areas of supply (selling interest) or demand (buying interest). Traders mark these zones on charts, often as gray rectangles, and monitor for price reactions when levels are revisited. Liquidity sweeps occur when price briefly takes out prior highs or lows before reversing into the block, suggesting institutional absorption of stop orders before the intended directional move.
Combining order blocks with VWAP and standard deviation bands creates layered entry logic. For example, a demand zone near the VWAP +2σ band might signal a high-probability long entry if price sweeps the low and reclaims the zone. Stop placement below the block protects against invalidation while the VWAP bands define profit targets. This multi-layer approach grounds discretionary zone trading in statistical context, reducing reliance on pattern recognition alone. Traders using these techniques anticipate institutional footprints, positioning ahead of larger moves rather than chasing price after the fact.
2. Trade Equity Curve Simulations (Monte Carlo)
These simulations project thousands of trade sequences using historical stats, revealing a strategy’s range of outcomes and identifying fragile edges.
Equity curve simulations use historical trading statistics (win rate, average win, average loss, reward-to-risk ratio) to run Monte Carlo-style projections. The model generates many hypothetical trade sequences, each applying the same statistical profile but randomizing order and outcomes. Results show a range of possible equity paths, from best-case to worst-case, over a defined number of trades (commonly 1,000).
For instance, 20 simulated paths might show a best-case outcome of $86,000 from a $50,000 starting balance, with the worst path yielding $74,000. This range quantifies strategy robustness. Adjusting parameters reveals sensitivity: reducing win rate from 60% to 55% might still produce profit, but a further drop to 45% could expose breakeven or losing scenarios. These simulations identify tipping points where small performance degradation shifts a strategy from strongly profitable to marginal. Traders use this insight to set realistic performance targets and recognize when execution quality has slipped beyond acceptable bounds, turning abstract stats into visual risk assessment.
1. SimpleTraderFunding.com (Prop Firm Discount Hub)

This aggregator site lists active promotions and discount codes for prop firm evaluations, reducing entry costs significantly.
SimpleTraderFunding.com aggregates promotional deals from various proprietary trading firms, functioning as a discount hub for evaluation accounts. The site lists current sales, such as Apex Trader Funding’s periodic promotions offering up to 90% off evaluation costs, and provides discount codes (for example, “ST”) that unlock lower prices at checkout. Evaluation accounts that typically cost hundreds of dollars become accessible for as little as $20 during active promotions.
For traders exploring multiple prop firms or testing different account types, this hub consolidates deal-hunting into a single resource. The cost savings allow participation in evaluations with reduced financial risk, making it feasible to trial different firm rule sets or account sizes before committing larger sums. Traders seeking efficient capital allocation use platforms like SimpleTraderFunding.com to access funded trading opportunities without overpaying for initial evaluations.