After a three-year investigation into the trustworthiness of tech reporting, the State of Tech Journalism Report uncovers some shocking truths: a thriving, for-profit fake review industry is taking over the web, with deceptive practices and fake product tests infiltrating even major platforms like Google.
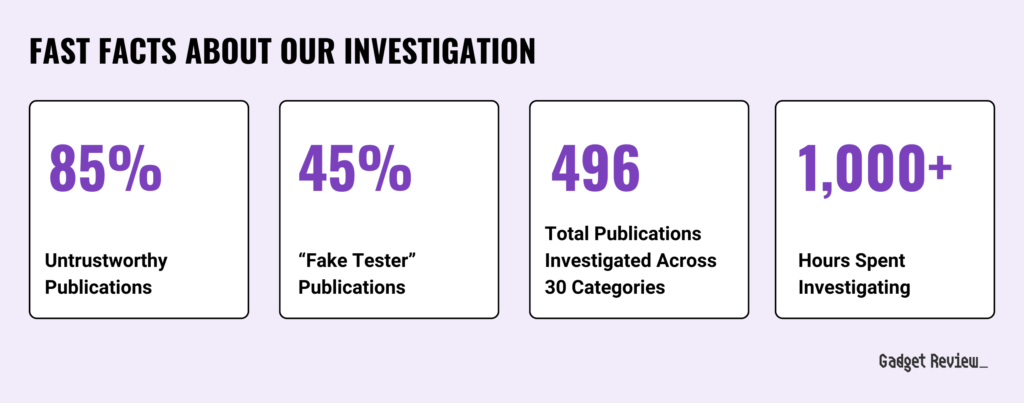
Our investigation covered 496 tech journalists, involved over 1,000 hours of work, and revealed that 45% of corporate-owned and small publishers produce fake product tests, with a staggering 85% classified as untrustworthy. For online shoppers and those who rely on journalism to guide their decisions, knowing who to trust has never been more critical.
Here’s a complete breakdown of the report, so you can explore the sections that matter most to you:
At the heart of this report is our Trust Rating system, which powers the True Score, the web’s most accurate product quality rating system. Think of it as Rotten Tomatoes for products—except instead of movies or TV shows, we evaluate everything from electronics to home tech, backed by data and transparency.
We analyzed tech journalists across 30 product categories, focusing on electronics and home appliances. Using 55 indicators, we measured expertise, transparency, data accuracy, and authenticity. Each publication earned a score from 0 to 100, placing them into one of six classifications: Highly Trusted, Trusted, Mixed Trust, Low Trust, Not Trusted, or Fake Reviewers.
This investigation uncovered some startling truths about the state of tech journalism. Here are the key takeaways that highlight just how deep the fake review problem runs.
Key Takeaways
- Almost half of all tech reviews are fake online: 45% of online tech reviews of the 496 publications in our data set across 30 categories are faking their product tests.
- 85% of online tech review publications are untrustworthy: Among the nearly 500 publications in our dataset, a significant portion are faking reviews.
- Five high-traffic sites with household brand names traditionally trusted by people are fake reviewers (AKA the Fake Five). Together, these five (Consumer Reports, Forbes, Good Housekeeping, Wired, and Popular Mechanics) alone bring in almost 260M monthly views – that’s about 23% of the total traffic in our entire dataset.
- The majority of corporate-owned publications suffer from fake testing. 54% of all the corporate-owned tech reviewers in our dataset have been labeled “fake reviewers”.
- Fake reviews are alarmingly common on the first page of a Google search. For terms like “best office chairs” or “best computer monitors”, 22% of the results will link directly to websites that claim to test products but provide no proof of their testing or even fake it.
- The only Highly Trusted publications (the highest trust classification a publication can earn) are independent, and there are not a lot of them. There are just 4 publications that managed our “Highly Trusted” classification – 0.8%.
- Not one of the 30 categories we researched into has more trusted reviewers than untrusted ones.
- Projectors are the least trustworthy category in our entire dataset. 66.7% of all of the tech reviewers we analyzed are faking their testing.
- While routers are the most trustworthy category in our dataset, only 19.5% of tech reviewers in this category were rated as “Trusted” or “Highly Trusted.” This highlights a generally low level of trust across all categories, despite routers leading the pack.
Despite the shocking numbers outlined above, the problem becomes even clearer when you look at the overall distribution of trust classifications.
The chart below exposes a troubling reality: nearly half of the reviewed publications fall into the “Not Trusted” or “Fake Reviewers” categories. It’s a wake-up call for the industry and consumers alike, emphasizing the need for greater accountability and transparency. Our goal is simple: to help you shop smarter, trust the right sources, and avoid the pitfalls of fake reviews.
Publication Trust Rating Classifications
496 publications were categorized into six classifications based on their Trust Ratings and amount of fake testing.
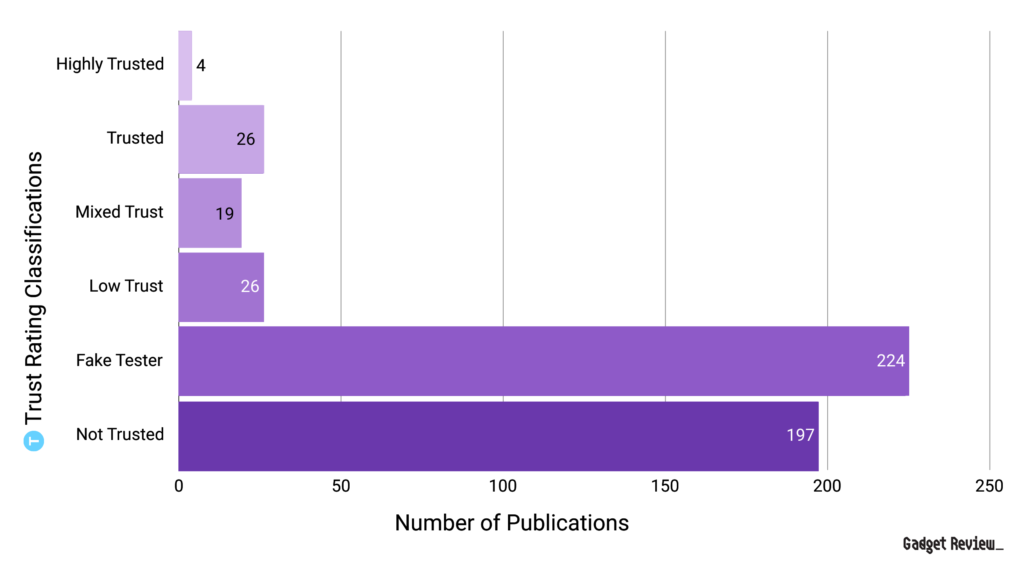
In the chart, only four publications made it into the ‘Highly Trusted’ category. That’s out of 496 total publications.
In Section 6, we take a closer and more balanced look at the top 10 and bottom 10 publications, grouping them by scope—broad (16+ categories), niche (3-15 categories), and hyper-niche (1-2 categories). This approach ensures a fair comparison among similar types of sites, giving deeper insight into how trust varies across different levels of specialization.
This report also highlights the Fake Five: five publications widely perceived as trustworthy and that have some of the highest monthly traffic in the industry. Despite their reputations, their reliance on fake testing earned them the “Fake Tester” label.
The Fake Five’s Categories by Trust Rating Classification
The chart shows the distribution of trust classifications across five major publications, providing the number of categories in each classification.
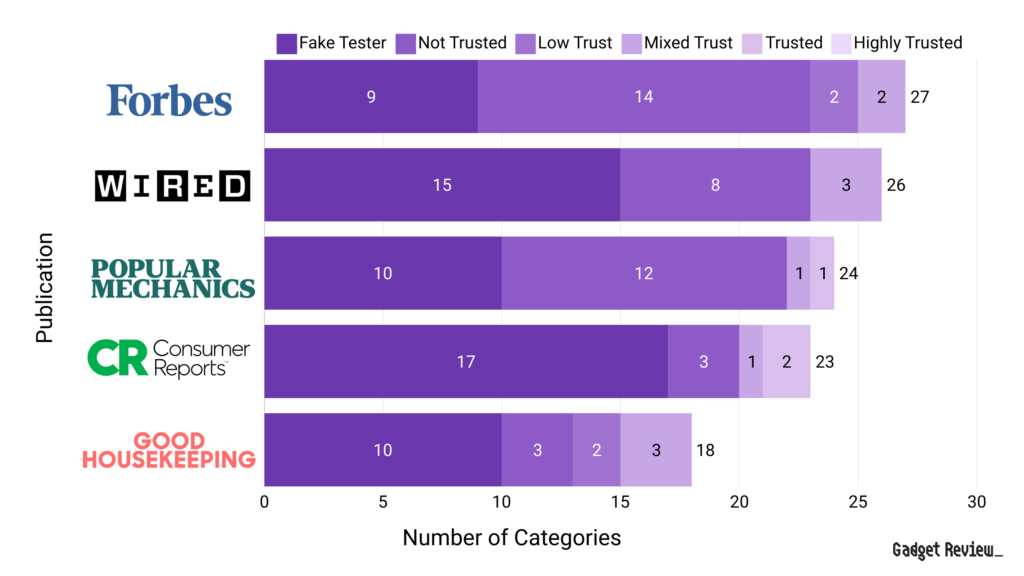
As shown above, Forbes leads with 27 total categories, including 9 classified as “Fake Tester.” WIRED follows closely with 26 total categories, 15 of which are “Fake Tester.” Popular Mechanics has 24 total categories, with 10 classified as “Fake Tester.” Consumer Reports, with 23 total categories, shows significant signs of fake testing in 17 of them—that’s over half of their categories. Good Housekeeping has the fewest total categories at 18 but still includes 10 “Fake Tester” categories. This underscores the pervasive issue of categories with fake tested reviews across these famous publications.
These brands, with their enormous reach, have a duty to deliver trustworthy reviews. Yet, their reliance on fake testing continues to damage reader confidence, further highlighting the urgent need for accountability in tech journalism.
While our findings during our investigation may seem disheartening, our goal isn’t to dismiss untrustworthy publications, which we expand on in the next section.
Why We Created This Report
The findings of this report highlight a widespread issue, but our intention is not to simply expose and dismiss these companies.
Instead, we aim to engage them constructively, encouraging a return to the fundamental purpose of journalism: to speak truth to power and serve the public.
Our goal is to hold powerful corporations and brands accountable, ensuring that consumers don’t waste their money and time on low-quality products.
We view this as part of a broader issue stemming from a decline in trust in media over recent decades, and we are committed to being part of the solution by helping restore that trust.
Methodology
Reliable statistical insights begin with a solid, transparent methodology, forming the foundation for every conclusion. Here’s how we approached our three-year investigation:
- Leverage Category Expertise: We started by identifying 30 core product categories, pinpointing the most critical criteria to test, determining how to test them, and defining the appropriate units of measurement. This ensured a comprehensive understanding of each category’s standards.
- Develop Trust Rating System: Next, we created a quantifiable framework to evaluate the trustworthiness of publications. The system measured transparency, expertise, rigorous testing practices, and more, providing an objective and reliable assessment of each review’s credibility.
- Collect Data & Conduct Manual Reviews: Using web-scraping tools, we gathered data from hundreds of tech and appliance review publications. Human researchers then manually reviewed the findings using the Trust Rating System to classify reviewers into categories like “Highly Trusted” or “Fake Reviewer.”
- Analyze Findings: Finally, we applied statistical and quantitative methods to uncover trends, identify patterns, and generate actionable insights. This rigorous analysis ensured every conclusion was grounded in reliable data.
1. Category Expertise: The Foundation of Our Investigation
Our journey began with a key step: leveraging our expertise in electronic and appliance categories to create a road map for evaluating each product category. This meant diving deep into what makes a product category tick—understanding its key performance criteria, testing methods, and units of measurement. This groundwork was essential to building a consistent and accurate framework for assessing the trustworthiness of publication reviews.
We began by identifying 30 core categories that encompass the tech and appliance landscape, including popular products like air conditioners, air purifiers, blenders, gaming chairs, gaming headsets, and more.
Twelve of these are published categories on Gadget Review, while the remaining 18 are former review categories we pruned to focus on a more streamlined and curated selection of content.
Each category demanded its own approach, and this initial research gave us the tools to evaluate them fairly and accurately.
2. Trust Rating System: A Rigorous Framework for Evaluating Credibility
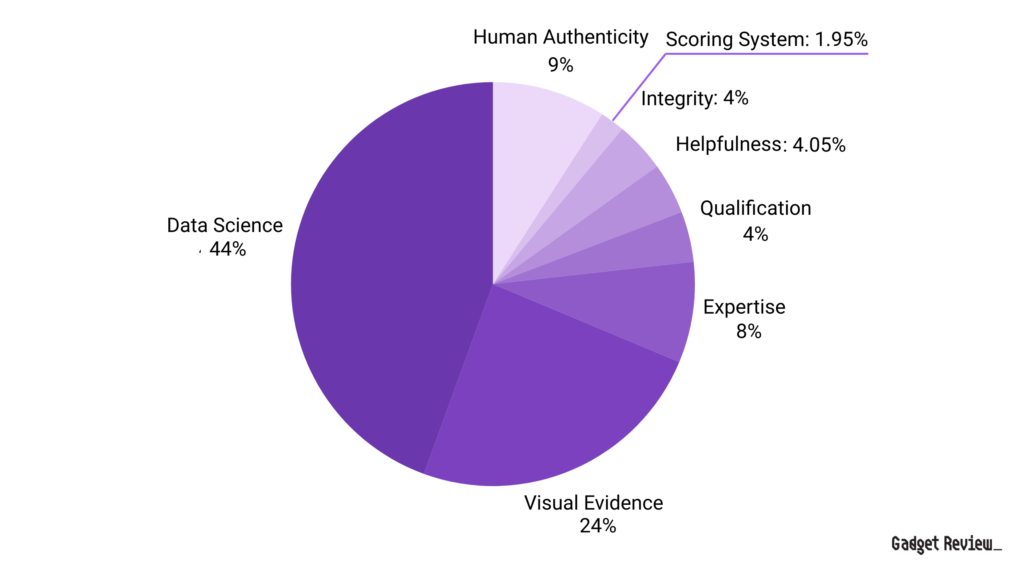
We proceeded to develop the Trust Rating System, a proprietary system designed to measure the credibility and reliability of product reviews and reviewers. This system evaluates publications using 55 indicators across 8 subcategories, providing a detailed assessment of transparency and expertise within a specific product category.
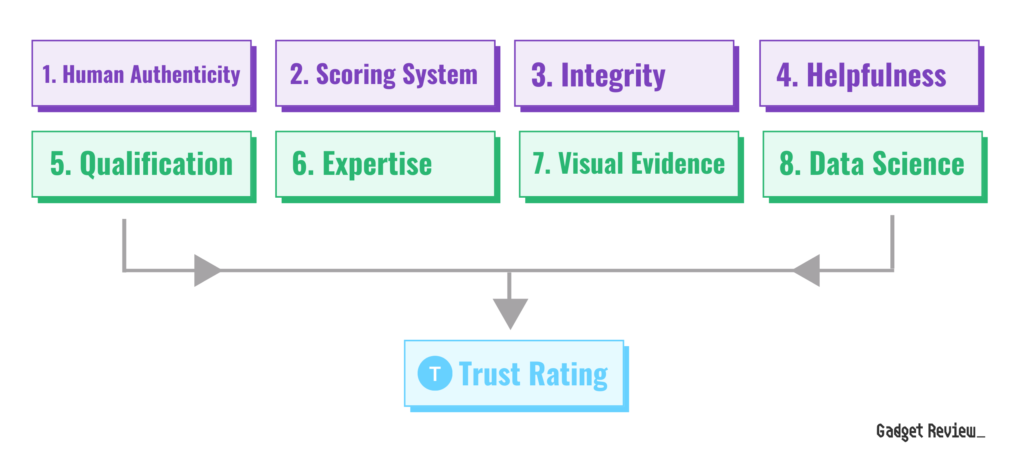
The ratings use a logarithmic scale from 0 to 100, classifying publications into six categories: Highly Trusted, Trusted, Mixed Trust, Low Trust, Not Trusted, and Fake Reviewers.
Our Trust Ratings are the foundation of the True Score, the web’s most accurate product quality score. They cut through the noise, filtering out fake reviews to deliver a reliable way to identify quality products.
It all starts with evaluating publications and assigning Trust Ratings. Only the most credible sources contribute to the True Score, ensuring trust and transparency.
Expert reviews account for 75% of the True Score, while verified customer reviews make up the other 25%. This blend balances professional insight with real-world feedback for a complete picture.
Our powerful Bayesian model brings it all together. It filters out fake reviews, weighs the data accurately, and adapts as new info rolls in.
The result? A product score you can trust every time.
By incorporating these parameters above, our Trust Rating System ensures a fair and accurate comparison between publications. This structured approach highlights how sites perform within their peer groups, giving readers the clearest picture of trustworthiness across the industry.
Below, we break down the key indicators’ categories, and the rationale behind their weightings.
In total, there are 55 indicators. Together, they encompass aspects such as review authenticity, evidence of testing, reviewer expertise, transparency, and consistency.
Each category is further divided into subcategories, enabling a detailed and granular analysis of each publication’s practices.
Now that you understand how our Trust Rating system evaluates the credibility of review sites, let’s look at how we collected our data, selected the sites, and determined which reviews warranted a closer look.
3. Data Collection & Manual Review of Data
This study employed a robust data collection process to evaluate the trustworthiness of tech journalism over a three-year period, from June 24, 2021, to June 21, 2024. By combining advanced tools and meticulous manual reviews, we ensured a thorough analysis of publications across the tech and appliance industries.
- We identified publications by analyzing the first page of Google search results for transactional and popular tech or appliance-related keywords. This process used web scraping tools, Google Keyword Planner, and Ahrefs, with manual reviews added for accuracy and completeness.
- A total of 496 tech and appliance publications were selected, representing a mix of high-traffic, well-known sites and smaller niche publishers.
- While ~200 publications dominate in traffic, this dataset captures the broader spectrum of sites receiving web traffic in these verticals.
Once we collected our data, we moved on to analyzing the dataset.
4. Analysis Methods
With our trust ratings established, we employed a variety of analytical techniques to explore the data and uncover meaningful insights:
We utilized descriptive statistics to understand the distribution of trust ratings across publications. This included measures of central tendency (mean, median, mode) and dispersion (standard deviation, range) to characterize the overall landscape of tech review trustworthiness.
Statistical analysis was conducted on our dataset to understand the distribution and spread of trust ratings across 496 sites, ensuring our methodology captures meaningful trends.
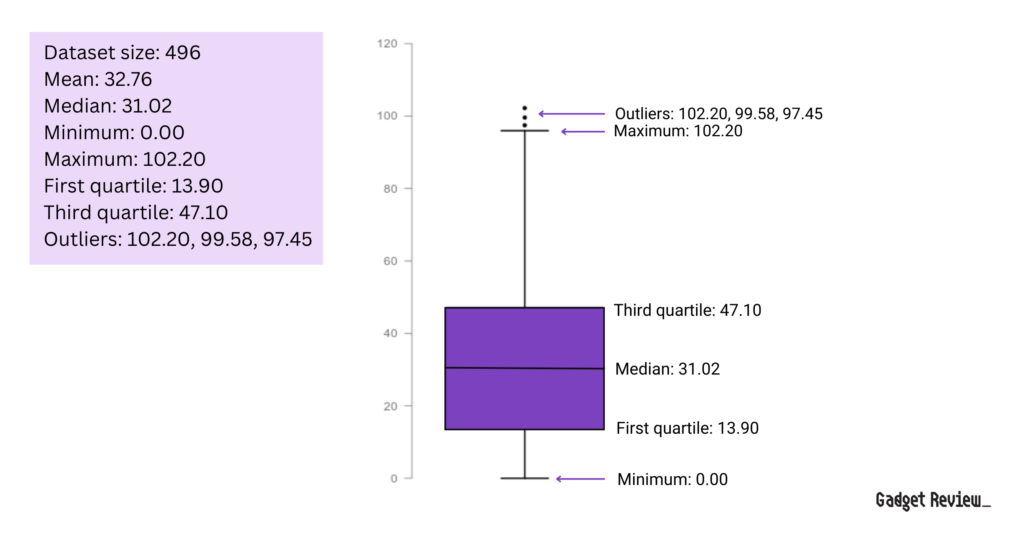
The mean trust rating is 32.76, with a median of 31.02, indicating that most scores cluster around this range, which in concerning since that means most sites in the dataset are failing and untrustworthy. The first quartile (13.90) and third quartile (47.10) highlight the range in which most trust ratings fall. Outliers like 102.20 and 99.58 showcase exceptional ratings.
This multifaceted analytical approach allowed us to not only quantify the trustworthiness of individual publications but also to uncover broader trends and patterns in the tech review landscape.
By combining rigorous data collection with comprehensive analysis, we were able to provide a detailed, data-driven picture of the state of tech reviews and the factors that contribute to review integrity and consumer trust.
To analyze the collected data and derive meaningful insights, various tools were employed.
Good tools and software are essential in producing reliable statistical reports, as they directly influence the accuracy and integrity of the data collected.
Advanced software streamlines data gathering and processing, minimizing errors and ensuring consistency throughout the analysis.
By leveraging data analysis tools and data visualization software, we can efficiently manage large datasets, apply complex analytical methods, and visualize trends with precision.
These resources lay the groundwork for trustworthy insights, making it possible to draw meaningful conclusions that stand up to scrutiny.
- Data Analysis Tools: AirTable and Google Sheets were the primary tools used for data capture and analysis.
- Data Visualization: Tools like Canva, Adobe Illustrator and ChatGPT were used to create visual representations of the data, aiding in the interpretation and presentation of findings.
By employing these methodologies, this study provides a robust and comprehensive analysis of the trustworthiness of tech journalism, offering valuable insights into the prevalence of fake reviews and unreliable testing.
The Broader Issue
To understand the depth of this issue, we focused on five key areas: the overall decline in reviewer quality, the fake review industry on Google, the significant role of corporate-owned media in disseminating misinformation, the trust gap between corporate and independent publishers, and the issues with various product categories.
While corporate giants are often more manipulative, independents also struggle with credibility.
This report underscores the urgent need for a renewed commitment to transparent and honest journalism, ensuring that tech reviews genuinely serve consumers and restore public trust.
1. Google Is Serving Up Fake Reviews
Every day, Google processes around 8.5 billion searches. That’s a mind-blowing number. And with that amount of influence, Google plays a huge role in what we see online.
Despite their efforts to remove fake reviews from search results, our investigation into 30 tech categories shows that Google is still serving up a whole lot of fake reviews. These untrustworthy reviews are sitting right at the top of the search results on page 1, where most of us click without thinking twice.
Big names like CNN, Forbes, WIRED, Rolling Stone, and the most popular tech reviewers like Consumer Reports, TechRadar, and The Verge, along with independent reviewers, are all part of this huge problem of fake reviews.
Key Takeaways
- Half of Google search results for tech reviews are untrustworthy. 49% of the results on page one of a Google search for terms like “best tv” will direct you to an unhelpful site with low trust, no trust, or even outright fake testing. Meanwhile, only 51% of the results will be some degree of trustworthy.
- A quarter of the results on the first page of Google are fake. 24% of the results on the first page of a search for terms like “best office chair” will link directly to websites that claim to test products but provide no proof of their testing or even fake it.
- More than half of the top results for computer keyboard searches are fake reviews. A staggering 58% of page one results belong to sites that fake their keyboard testing.
- Google provides mostly helpful results when looking for 3D printers. An impressive 82% of page one results lead to trusted or highly trusted sites, with zero fake reviews in sight.
Trust Rating Classifications in Google Search Results
To figure out the key takeaways above, we had to first calculate the Trust Ratings across publications. Then, we Googled popular review-related keywords across the categories and matched the results with their respective Trust Ratings.
This allowed us to see, for example, how many of the results for “best air conditioners” on page 1 were fake, trusted, highly trusted, etc. We pulled it all together into the table below to make it easy to visualize.
In the table, the percentages in the Classification columns are the share of results that fall into each trust class. They’re calculated by dividing the number of results in that class by the total results we found in each category (Total Results in Category column).
As you can see below, these categories are swamped with fake or untrustworthy reviews. High-traffic, transactional keywords—where people are ready to buy—are overrun with unreliable reviews.
With so many fake reviews dominating the top spots, it’s clear there’s a serious trust issue in the results that 33.4 million people rely on every month.
Here’s a breakdown of the exact keywords we analyzed to uncover the full scope of the problem.
Our Dataset of Keywords
To accurately reflect what a shopper is facing on Google for each of the 30 tech categories, we analyzed 433 transactional keywords that total 33.4 million searches per month.
These keywords were divided into three distinct types, each representing a unique aspect of shopper intent:
| Type of Keyword | Definition of Keyword | Examples |
|---|---|---|
| Buying Guide | These keywords help shoppers find the best product for their needs based on a guide format, often used for comparisons. | best tv for sports, best gaming monitor, best drone with cameras |
| Product Review | Connect the user to reviews of individual products, often including brand or model names, targeting users seeking detailed product insights. | dyson xl review, lg 45 reviews |
| Additional Superlatives | Highlight specific features or superlative qualities of a product, helping users find products with specific attributes. | fastest drone, quietest air conditioner |
Together, these keyword types provide a comprehensive picture of how users search for and evaluate products, helping us reflect the challenges shoppers face when navigating Google’s crowded marketplace.
After analyzing our findings, it became clear that this is a deeply concerning situation—especially given Google’s massive reach and influence over what millions of users see and trust every day.
The Big Deal About This Massive Google Fake Review Problem
Researching products online has become a lot harder in recent years. Google’s constantly shifting search results and a steady drop in the quality of reviews from big outlets haven’t helped. Now, many reviews make bold testing claims that aren’t supported by enough or any quantitative test results.
We believe the 30 categories we analyzed paint a strong picture of tech journalism today. Sure, there are more categories out there, but given our timelines and resources, these give us a pretty accurate view of what’s really going on in the industry.
Nearly half the time, you’re dealing with unreliable reviews. And while some publications are faking tests, others may just be copying from other sites, creating a “blind leading the blind” effect. It’s almost impossible to tell who’s doing what, but it seriously undercuts the entire landscape of tech reviews.
It’s not just small players doing this. The biggest names in the industry are guilty, too. These corporate giants are leveraging their influence and authority to flood the web with fake reviews, all in the name of bigger profits. The next section breaks down how they’re fueling this problem.
2. The Corporate-Media Problem

While our dataset includes hundreds of publications, there’s a hidden layer often overlooked: the parent company.
At first glance, it might seem like individual websites are the main offenders, but the reality is far more interconnected. Many of these sites are owned by the same corporations. Imagine pulling fifteen publishers from a bucket—despite their unique names, several might belong to the same parent company.
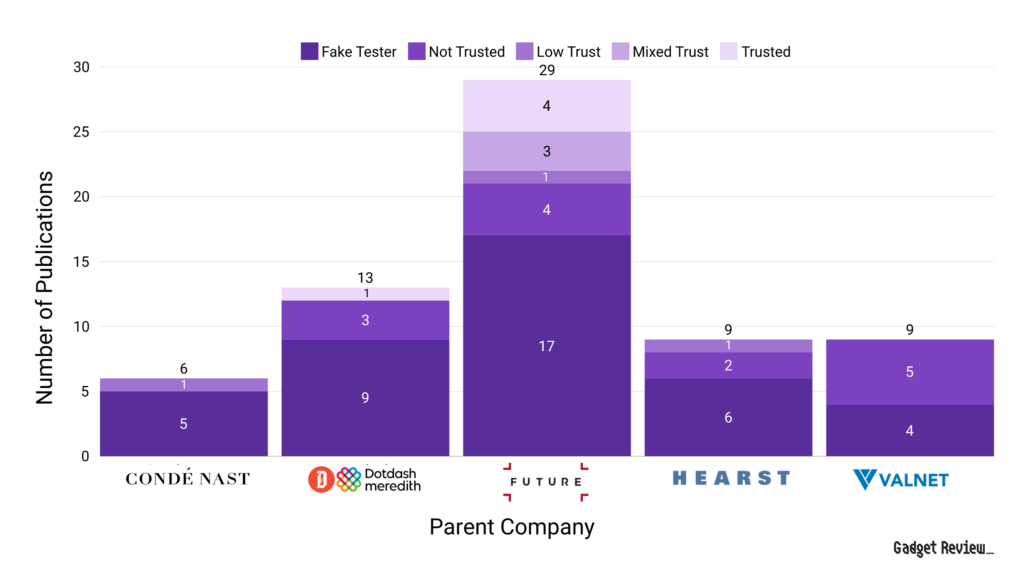
Take Future PLC, for example. Of the 29 sites they own in our database, 17 are designated as Fake Reviewers, while another 8 are labeled Not Trusted. These aren’t obscure outlets, either. Future owns high-traffic sites like TechRadar, GamesRadar, and What Hi-Fi?, all of which are plagued with fake reviews.
This raises a troubling point: the benefits of being owned by a parent company—such as consistent branding and oversight—aren’t translating into what matters most: rigorous, objective testing. Instead, publications under the same corporate umbrella often share information and imagery, amplifying half-baked work or even misinformation across multiple platforms.
In the worst cases, parent companies use their reach unscrupulously, pushing products or agendas without accountability. Many publishers see brands as clients rather than entities to scrutinize, prioritizing ad revenue over unbiased reviews.
The result? Corporate-owned media outlets are significantly more likely to manipulate reviews compared to independents—though independents aren’t without their issues. Every major “Big Media” company in our dataset has more fake reviewers under their control than any other category.
Key Takeaways
- Corporate publications are overwhelmingly unhelpful, untrustworthy, or outright fake. 89% of the corporate publications in our dataset are fake reviewers or labeled untrustworthy.
- You’re more likely to run into a fake reviewer when reading corporate-owned publications. 54% of the corporate-owned publications in our dataset have been classified as fake reviewers.
- No corporate publication is “Highly Trusted” according to our data and trust ratings. Out of the 201 corporate publications, there isn’t a single one that manages a Trust Rating of 90%. The highest Trust Rating a corporate publication earns is 82.4% (Sound Guys).
- Corporate publications dominate web traffic despite being extremely unhelpful. Of the 1.14 billion total monthly visits every site in our dataset sees combined, corporate publications receive 86% of that traffic.
- You have a better chance of getting useful information from an independent publication – but not by much. 6.8% of the independent sites we researched are trustworthy or highly trustworthy, while just 4.9% of corporate sites are trustworthy (and not a single one is highly trusted.)

- Future owns the most publications out of any of the corporate media companies in our dataset and has the most fake reviewers as well. Of the 29 publications they have, 17 of them are fake reviewers, including major outlets like TechRadar, GamesRadar, What HiFi? and Windows Central.
- The two highest-traffic publications that Future PLC owns are Tom’s Guide and TechRadar, and together account for 63% of the traffic that Future PLC publications receive. Unfortunately, TechRadar is classified as a Fake Reviewer (57.06% Trust Rating), while Tom’s Guide is stuck with Mixed Trust (65.66% Trust Rating.)

- Dotdash Meredith features some of the highest aggregate traffic numbers and leads all of the parent companies in combined traffic. Unfortunately, 9 of the 13 publications they own in our dataset are Fake Reviewers.
- A staggering 35% of the total traffic that Dotdash Meredith’s publications receive goes directly to Fake Reviewers, including websites like Lifewire, The Spruce and Better Homes & Gardens.
- The two highest-traffic publications Dotdash Meredith owns, People and Allrecipes, are classified as Not Trusted. This is troubling – despite not claiming to test products, they fail to establish what limited trustworthiness they can.

- The 9 Hearst publications we analyzed attract a hefty 38.8 million monthly visitors (source: Hearst), yet their average trust rating is just 32.65%. High traffic, but low trust.
- Example: Good Housekeeping has a troubling amount of fake testing plaguing 10 of their 18 categories.
- Only one publication owned by Hearst manages a Trust Rating higher than 50%, and that’s Runner’s World. Unfortunately, even it can’t break 60%, with a Trust Rating of just 59.98%
- The 9 Hearst publications we analyzed attract a hefty 38.8 million monthly visitors (source: Hearst), yet their average trust rating is just 32.65%. High traffic, but low trust.

- 5 of the 6 brands we analyzed from billion-dollar conglomerate Conde Nast faked their product tests including WIRED, GQ and Epicurious.
- WIRED is faking their reviews with a 32.36% trust rating across the 26 categories it covers. Worse still, of the categories we investigated, 15 of them have faked testing.

- Valnet is the only major parent company to have fewer publications faking their testing than not. Unfortunately, the 5 they own that aren’t faking their testing often aren’t testing at all, and none of them are classified better than Not Trusted.
- Valnet also earns the very bizarre accolade of receiving the least amount of traffic to publications labeled Fake Reviewers, meaning consumers are less likely to be served fake testing – unfortunately, the rest of the traffic is going entirely you publications that are Not Trusted.
Below is a table of the top 5 media conglomerates that dominate the product and tech review space. For our study, we analyzed publications from Future (the largest by number of publications), DotDash Meredith (the leader in traffic), Valnet (the youngest), Hearst (the oldest), and Condé Nast (the most well-known). This breakdown highlights their scale, influence, and estimated reach within the industry.
| Parent Company | Number of Publications | Estimated Annual Revenue | Monthly Estimated Traffic (Similar Web) |
|---|---|---|---|
| Future | 250+ (29 analyzed) | $986.1 million (source) | 321,587,741 |
| DotDash Meredith | 40 (13 analyzed) | $1.6 billion | 653,411,620 |
| Valnet | 25+ (9 analyzed) | $534.1 million | 296,405,842 |
| Hearst | 176 (9 analyzed) | $12 billion (source) | 307,141,647 |
| Conde Nast | 37 (6 analyzed) | $1.7 billion (source) | 302,235,221 |
Next, we’ll break down the Trust Ratings of all individual publications we investigated that are owned by these major parent companies.
Parent Company Trust Rating Distribution
We analyzed 66 publications across 5 corporate media giants, and the Trust Rating ranged from a low ranging from 9.30% Trust Rating (Harper’s Bazaar) to a 78.10% (Mountain Bike Rider).
Here’s some statistics of trust ratings for corporate-owned publications:
| Statistic | Value |
|---|---|
| Sample Size (n) | 66 |
| Mean | 40.14% |
| Median | 38.82% |
| Range | 9.30% to 78.10% |
| Standard Deviation | 16.17% |
The mean Trust Rating of just 40.14% highlights a significant trust deficit across the publications in this dataset. This already troubling average is compounded by an alarming minimum score of 9.30%, which suggests that some publications are almost entirely untrustworthy.
With such a low baseline, it’s clear that trust isn’t just inconsistent—it’s fundamentally broken for many of these outlets.
Now, we examine each major parent company, starting with the biggest Fake Tester—Future PLC. For each company, we’ll discuss their reputations and what went wrong in their reviews to result in such shockingly low average Trust Ratings.
2.1. The Largest Parent Company: Future PLC
You’ve likely encountered Future PLC’s sites, even if the company name doesn’t ring a bell. They own some of the biggest names in tech and entertainment, like TechRadar, Tom’s Guide, and Laptop Mag—popular destinations for phone, TV, and gadget reviews. With over 250 brands under their umbrella, Future is the largest parent company we investigated.
The Problem With Future’s Reviews
On the surface, Future’s brands appear trustworthy, but a deeper look tells a different story. Despite their massive reach—having over 100 million monthly visitors and generating about $986 million a year—Future’s trustworthiness crumbles, earning a low 44.65% Trust Rating across 29 of the publications we investigated.
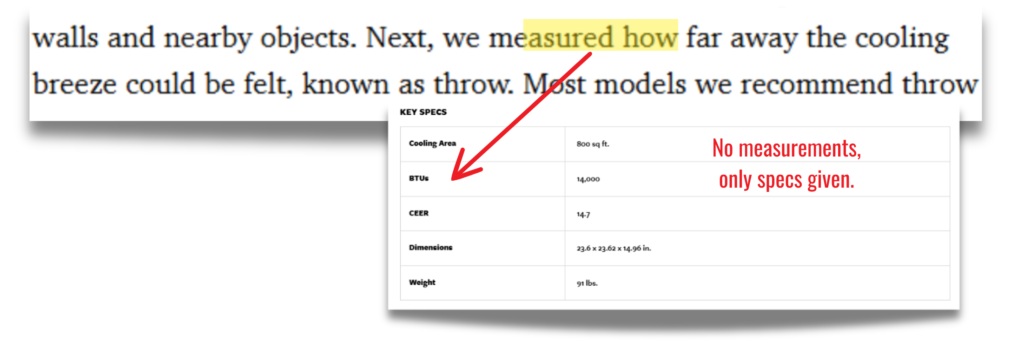
The issue? Their reviews often lack quantitative test results that prove the true performance of the product. For instance, you need a sophisticated colorimeter and calibration software to measure the color gamut of a monitor (in %). Readers need to make informed decisions—so they might consult somewhere like TechRadar or Laptop Mag. One would expect to find detailed test results at either publication, but in reality, the results nowhere to be found, like below—only product specs, like in the screenshot below from Techradar’s HyperX Armada 27 review.
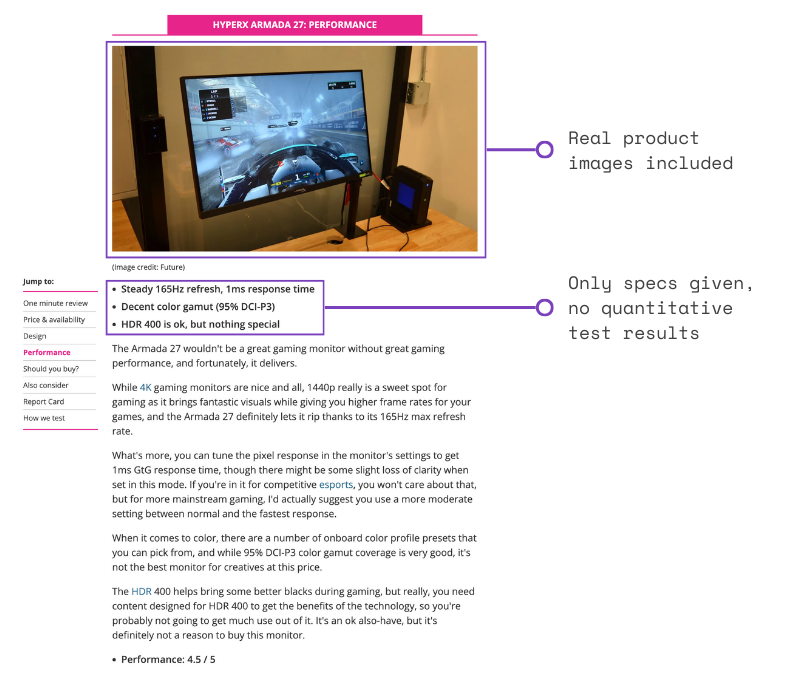
What’s even worse besides the lack of test results above? Future has scaled its less trustworthy sites like TechRadar because it’s more profitable to do so, but this also means that 17 of the publisher’s websites have earned “Fake Tester” labels. By skipping proper testing cuts costs, Fake Testers not only minimize overhead, but can still draw massive traffic and profits, proving that fakery pays off.
Meanwhile, their smaller sites we do trust like Mountain Bike Rider and AnandTech—which was recently shut down—receive far less traffic and attention. Why? Building genuine trust is more expensive and harder to scale.
The bottom line? Future is chasing profits at the expense of their readers.
To win back trust, they need to stop prioritizing quick cash and scale, and instead focus on real testing, transparency, and putting reader trust ahead of shareholder demands.
Their Trust Rating Breakdown: Mostly Fake Testers
Look at all of their trust ratings grouped by classifications below. See the huge group of sites labeled as Fake Testers versus the few that we actually trust? And to make it worse, the most trusted sites barely get any traffic, while the ones publishing fakery are raking in millions of visitors.
TechRadar’s Illusion of Testing
TechRadar is one of the most popular tech sites in the world. They earned an overall Fake Reviewer classification with a 57.06% Publication Trust Rating.
We investigated 27 of their product categories, and 8 received a Fake Reviewer classification such as gaming monitors and drones. We trust their coffee maker (85.27% Trust Rating) and VPN (81.00%) reviews, but we steer clear of them when it comes to fans (11%) and cell phone insurance (15%) reviews.
TechRadar’s review style often gives the impression of thoroughness—they definitely use these products they review. They almost always score well on Test Indicator 8.5 that looks for the reviewer using the product in a realistic scenario. But they tend to stop short of real performance testing, leaving out the test results and benchmarks needed to back up their test claims.
They provide units of measurement only half the time and barely include quantitative test results. So sometimes TechRadar tests, but it’s not consistent enough.
Here’s what we found in their Gaming Monitor category for example.
They earned a 39% Trust Rating in this category, and we found their claim to test to be untruthful (Test Indicator 8.11).
We investigated their HyperX Armada 27 review, and right off the bat, and you’ll notice at the top of all their product reviews, TechRadar provides this message that they test every product or service they review for hours.
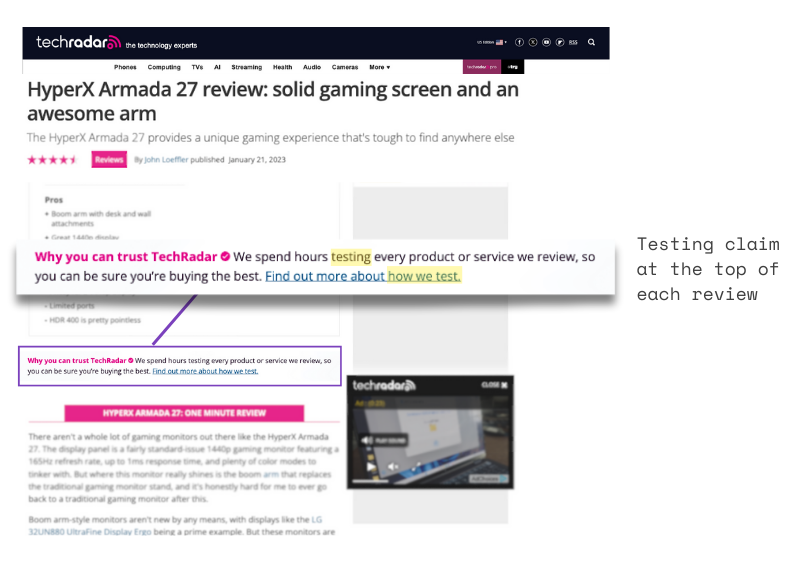
So they’re setting our expectations immediately that we should see test results on the Armada 27 in this review.
Again, this is a disappointing pattern across many of TechRadar’s other categories where they also end up labeled as Fake Testers. You can dig into more in the table at the bottom of this section.
But TechRadar doesn’t have bad Trust Ratings all around. They still get some credit for testing in certain categories, like coffee makers (85.27% Trust Rating). They’re the third most Trusted publication for coffee maker reviews behind CNET and TechGear Lab.
Our team investigated their Zwilling Enfinigy Drip Coffee Maker review by Helen McCue. She definitely used the coffee maker to brew a full carafe plus provided her own quantitative test results.
In the screenshot below, she measured brewing speed by brewing a full carafe in about nine minutes. Notice how she included the unit of measurement (Indicator 8.4).
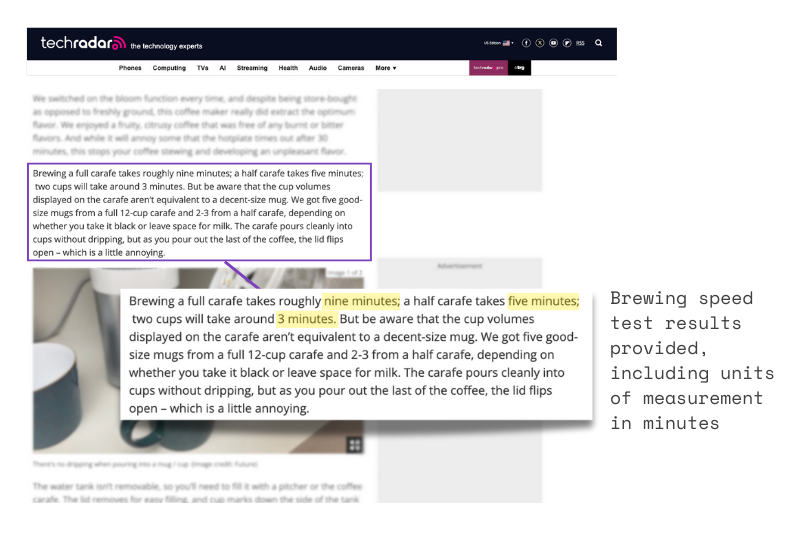
We generally recommend naming the equipment you use to test something, so while it’s obvious she used a timer or her phone for this, in other cases, like testing color gamut or luminance, knowing what software and/or hardware was used to test it is extremely helpful.
This pattern of fake reviews extends across Future’s portfolio, including the popular site GamesRadar.
GamesRadar? Same Smokescreen
Expand this section by clicking the “SHOW MORE +” for a deeper dive into GamesRadar’s review practices and why it earned a mediocre 39.01% Trust Rating.
We looked at 6 of their product categories, and half of them contain fake testing claims. We only trust one category of theirs–TVs (73.80% Trust Rating) which had enough test results and correct units of measurement to pass. We’re definitely avoiding their routers (23.00%) and office chair (73.80%) reviews though.
GamesRadar’s reviews look legit at first. They’re usually written by expert journalists with at least 5 years of writing experience, and they definitely use the products. They take tons of real photos, so GamesRadar tends to score well on Test Indicators 7.1 and 7.2.
But they skimp out on testing by providing no hard numbers and units of measurment, despite claiming to test. They also barely have any category-specific test methodologies published (Test Indicator 8.1).
We found in this fake testing claim and lack of evidence in their Router category, for example. Hence why it got a Fake Tester label.
We looked into their ASUS ROG Rapture GT-AX11000 Pro review, and right away, you’ll notice that while they claim to test their routers, there’s little evidence of test results.
At the bottom of the review, you’ll notice how the author Kizito Katawonga claims to test the router.
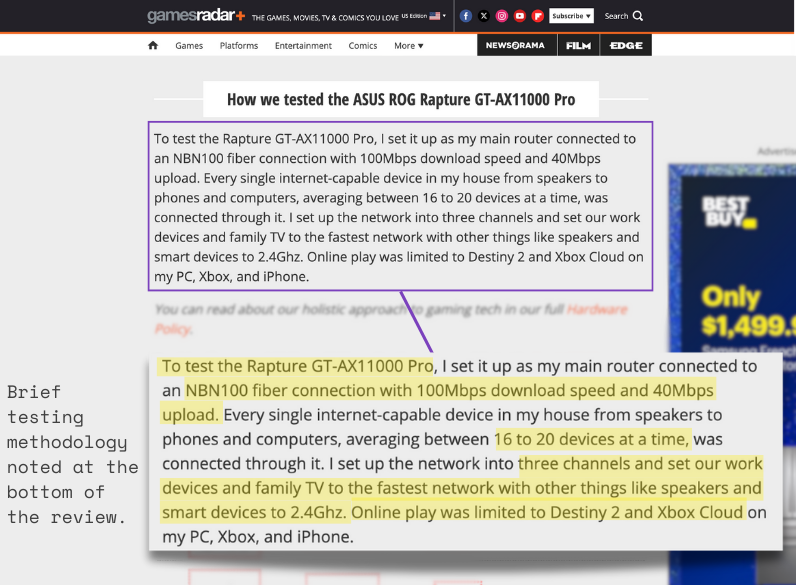
He explains his process for “testing”. The author explains how he set up the ASUS as his main router, connecting 16 to 20 household devices and dividing them into different network channels. He then tested it through regular usage, including gaming and streaming, but this approach lacks the objective, data-driven testing needed for a comprehensive review.
If you scroll up to the Performance section, he admits he doesn’t have the equipment to properly test the router’s performance objectively.
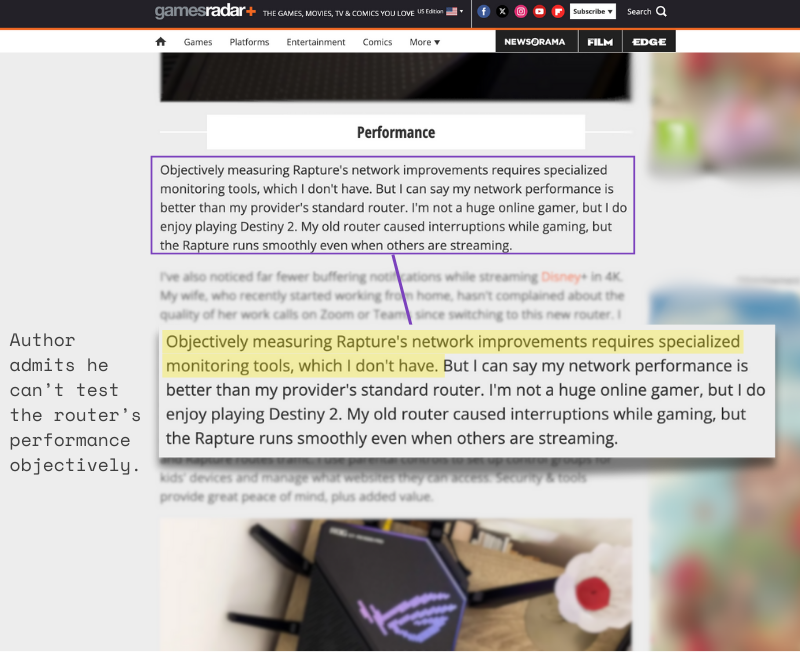
So, if he isn’t able to test it properly… why is he saying he tested it? Now I’ve lost confidence in the reliability of this review.
If you scroll further up, he’ll mention the specifications in detail, but when it comes to actual performance data, nothing is provided. He simply talks about the specs like maximum speeds and talk about how the router should perform.

But he says nothing about how the router did perform in regards to quantitative test results. The author should have tested the router’s download/upload speeds, latency, and range using tools like browser speed software, ping tester apps and heat map software.
This lack of real testing isn’t just limited to routers—it’s a recurring issue in several of GamesRadar’s other categories with low trust scores. You’ll find similar patterns across the board in the table below.
However, not all of GamesRadar’s reviews are unreliable. We trust their TV category, for instance, which got a passing Trust Rating of (73.80%).
A team member investigated this insightful LG OLED C1 review.
The author, Steve May found the HDR peak brightness to be 750 nits, so he got GamesRadar points for one Test Criteria and the correct units of measurement (Indicator 8.4).
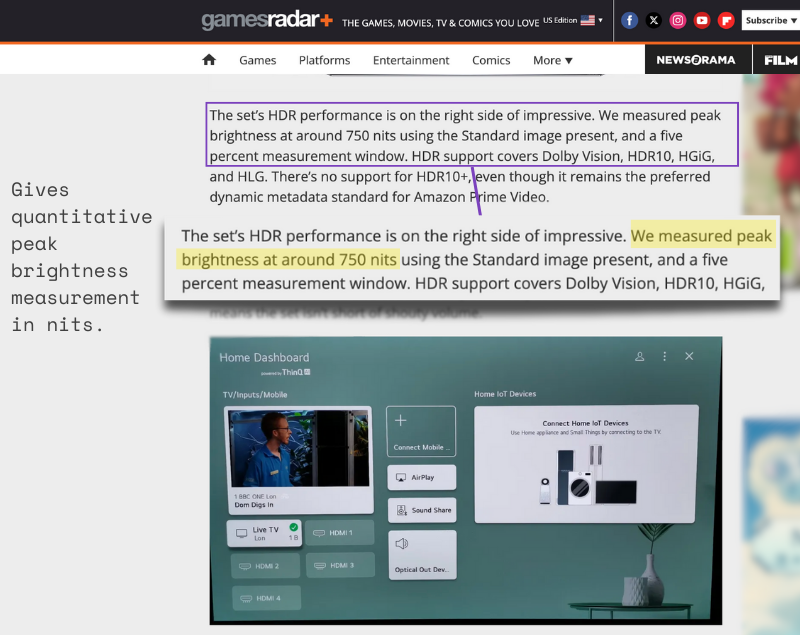
The only thing missing for that measurement is what kind of luminance meter he used.
Same story with his input lag measurement of 12.6ms.
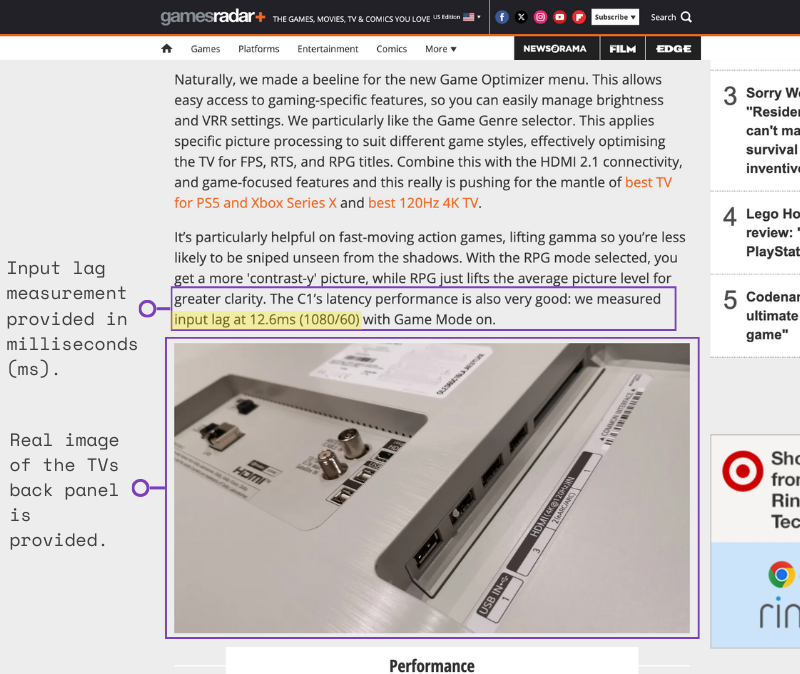
These measurements are helpful, and for even better transparency, we’d like to know the input lag tester and/or camera he used.
He provides some real photos of the TV’s screen and back panel.
So there’s even more evidence that he used this TV.
We’re overall more confident in the reliability of this review on the LG OLED C1 TV versus that ASUS router review. These test results are why GamesRadar’s claim to test in TVs was found to be truthful.
If you want to dig into the other 4 categories we investigated on GamesRadar, check out the table below.
Show more +What’s the future hold for Future PLC?
As you see, Future’s reviews lack test results, units of measurement, and clear methodologies needed to back up their test claims. They’re still written by expert journalists who definitely use the products. But without the testing evidence, their credibility takes a big hit. Ultimately, this reveals a huge problem—Future is prioritizing profits over readers. To rebuild trust, they need to make some changes:
- If they have the hard data, equipment, and methodologies, then simply show the work.
- If Future can’t provide the evidence to back up the testing claims, it’s time to adjust the language in their reviews. Rather than saying products are “tested,” they should call these reviews “hands-on”, meaning that they’ve used the products without rigorous testing.
- They should also remove the “Why Trust Us” banners at the top of every review on fraudulent sites like TechRadar and Digital Camera World.
These changes would eliminate any perception of fakery and bring a level of transparency that could help restore trust. Future still publishes valuable reviews, but they need to align with what they’re actually doing.
Transparency is key, and Future has the potential to lead with honest, hands-on reviews, even if they aren’t conducting full-on tests.
2.2. The Parent Company with the Most Traffic: Dotdash Meredith
Google receives over one billion health-related searches everyday. Health.com often tops the list of results when people look for advice.
It’s one of 40 brands under Dotdash Meredith, a media giant founded in 1902, now generating $1.6 billion annually. While they don’t have as many publications as Future PLC, they’re the biggest in terms of revenue.
But here’s the catch: money doesn’t always mean trust.
You’d think a company with such a strong legacy would deliver trustworthy content across the board. And to be fair, their home and wellness advice is generally solid. But when it comes to product reviews? They often miss the mark.
Dotdash Meredith’s Trust Rating reflects this gap, coming in at a mediocre 40.53% across 13 publications. One big red flag about their 13 publications is that 9 of them are Fake Testers.
The reason for all these Fake Tester classifications? Many of their reviews are labeled as “tested,” but the testing isn’t real. Instead, Dotdash has prioritized speed and profitability, pumping out content that drives revenue rather than builds trust.
What used to be a focus on educational content has shifted. These brands are now leaning heavily into affiliate marketing, using product reviews as a quick cash grab. And let’s face it—thoroughly testing products takes time and money, two things that don’t fit neatly into this new strategy.
Trustworthy? Not so much. Profitable? Absolutely.
What does this mean for readers? Dotdash Meredith seems more focused on driving sales than delivering truly trustworthy content. When it comes to health or home advice, take a hard look—because it’s not just your trust on the line. It’s your life and your money, too.
Dotdash’s Trust Rating Breakdown Across Publications
The brands DotDash owns break down to:
As you can see above, Dotdash Meredith’s publications we investigated have a concerning pattern of trust issues. Better Homes & Gardens and Allrecipes both fall below the 50% threshold, indicating significant reliability concerns despite their household names.
The Spruce Eats and The Spruce Pets all cluster in the mid-30% range, with their trust ratings signaling a lack of credibility in their content. Even niche brands like Trip Savvy and Food and Wine score alarmingly low at 30.74% and 20.15%, respectively.
These numbers underscore a systemic problem across Dotdash Meredith’s portfolio, where only one brand—Serious Eats—rises above the threshold of truly trustworthy content.
Their priorities are clear: speed and profit come first, while trust falls to the back of the line. This is painfully obvious in their approach to reviews.
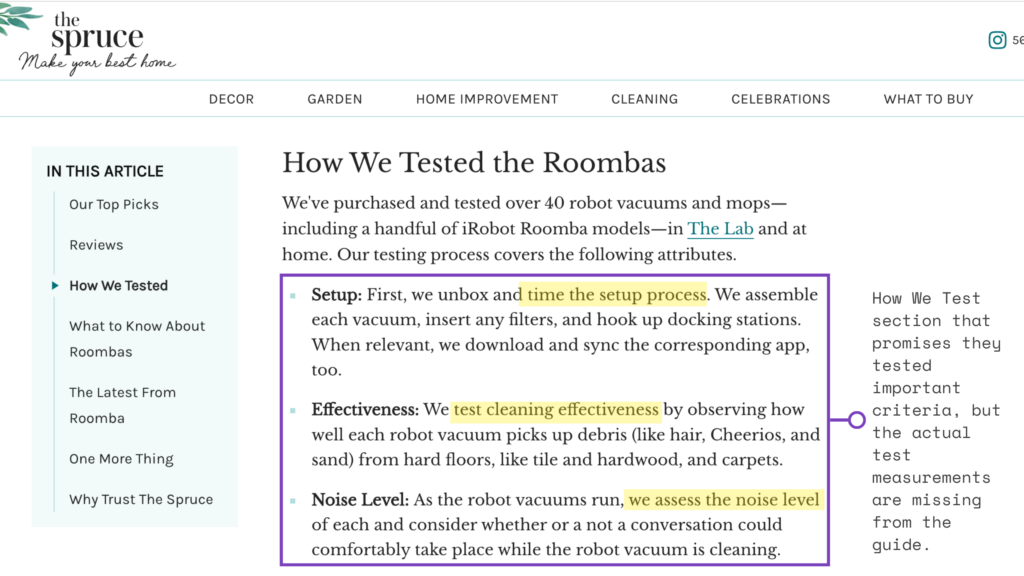
Look at sites like Very Well Health and The Spruce. Both include a “How We Tested” section at the bottom of reviews. At first glance, this looks great. But dig deeper, and you’ll find a glaring issue—they never actually share the results of their so-called tests.
Let’s break this down with Very Well Health as an example of how misleading these practices can be.
How Very Well Health makes it seem like they’re testing.
Very Well Health is widely regarded as a trusted source for reliable, accessible health information crafted by healthcare professionals. On the surface, it’s a beacon of credibility. But dig a little deeper, and the cracks start to show—especially with their 24.70% Trust Rating across two categories out of the 30 we investigated.
So what went wrong with this so-called “trusted” resource?
In their air purifiers buying guide, the “How We Tested” section (screenshotted below) looks promising, suggesting they’ve evaluated key criteria like noise levels (dB) and air filtration rates (ACH or CADR)—what they vaguely refer to as “effectiveness.”
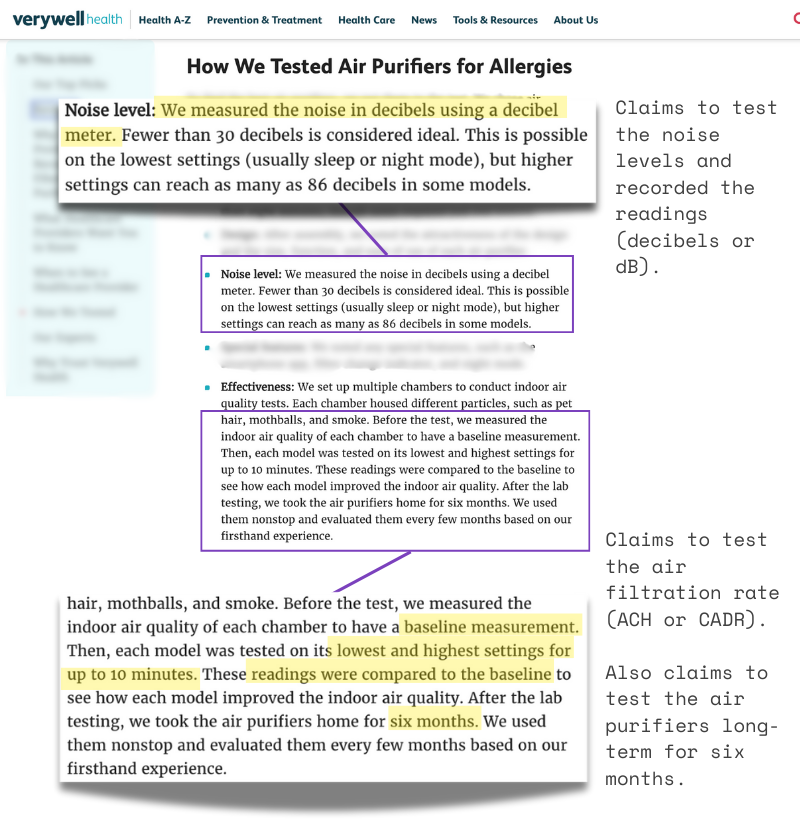
But here’s the issue: it stops at appearances. As we point out above, there’s no actual evidence or detailed results to back up these claims. For a site built on trust, that’s a major letdown.
With 9 out of the 13 Dotdash-owned publications we investigated classified as Fake Reviewers, there’s a lot of work for them to do in order to address these fraudulent practices.
Can DotDash regain our trust again?
Dotdash Meredith has two clear paths to rebuild trust.
- If their brands are truly testing the criteria they claim—like noise levels, debris pickup, or air filtration rate—they need to prove it. Show the data. Readers deserve to see the actual test results.
- The “How We Tested” sections either need to be removed or rewritten to clearly state these reviews are based on research or hands-on impressions—not testing.
If they’re not testing, they need to stop pretending. Reviews shouldn’t say “tested” when they’re just researched.
These aren’t complicated fixes, but they’re critical. Dotdash has a real opportunity to set things right. It starts with one simple thing: being honest about what they’re doing—or what they’re not.
2.3. The Youngest Parent Company: Valnet
Among the publishing giants we analyzed, Valnet is the youngest. Founded in 2012, this Canadian company has quickly built a portfolio spanning everything from comics to tech, with popular sites like CBR and MovieWeb under its wing. Owning over 25 publications, Valnet ranks as the fourth-largest parent company in our analysis.
We investigated 9 of Valnet’s publications, and unfortunately, the company earned a poor average Trust Rating of 36.56%. With sites like Make Use Of and Android Police in its fold, this shouldn’t be the case, being brands long considered reliable in the tech world.
So what’s the problem? Despite clear testing guidelines, our investigation into several categories revealed troubling inconsistencies. Testing TVs and soundbars is undeniably challenging, but if you’re not doing it thoroughly, it’s better to avoid the claim altogether.
For the average reader, this means opening a Valnet-owned publication comes with serious trust concerns. And even if you stumble upon one of their honest publications, the content still doesn’t inspire confidence. The Trust Ratings are bad across the board.
Both Valnet’s tested and researched reviews are low-quality.
Valnet’s core problem isn’t just Fake Testers—though that’s still a major issue. Out of the 9 Valnet publications we analyzed, 4 are Fake Testers. But even beyond fake reviews, the rest of their content doesn’t fare much better. When they’re not serving up fake testing claims, they’re publishing low-quality reviews that fall short of being genuinely helpful.
Over half of their publications earned a Not Trusted classification. This means they either test truthfully but don’t test enough, or they skip testing entirely and offer lackluster researched reviews. It’s one thing to lie about testing, but it’s another to fail our 55-point inspection so badly that even a Low Trust score is out of reach. These publications aren’t just misleading—they’re failing to provide readers with useful, actionable information.
And that’s Valnet’s biggest issue: when they’re not faking reviews, they’re simply not putting in the effort required to earn trust.
But let’s not forget—fraudulent reviews are still a significant part of Valnet’s portfolio, and that’s a red flag that can’t be ignored.
The Fakery at Android Police
Android Police has built a reputation as a go-to source for Android news and reviews, popular among tech enthusiasts. But when it comes to their reviews, readers should tread carefully. With a 40.92% Trust Rating and a Fake Tester label, it’s clear their credibility doesn’t hold up. They’re one of four Fake Testers we uncovered in Valnet’s portfolio of nine publications.
Five of Android Police’s 14 categories we investigated contained fake testing, including VPNs which received a 17.75% Trust Rating. The issues with their VPN guide are hard to ignore.
For starters, there are no screenshots of the authors, Darragh and Dhruv, actually using the VPNs they recommend. In the screenshot below, their VPN reviews lack quantitative data like download speeds (Mbps) or latency (ms)—essential metrics for evaluating VPN performance.
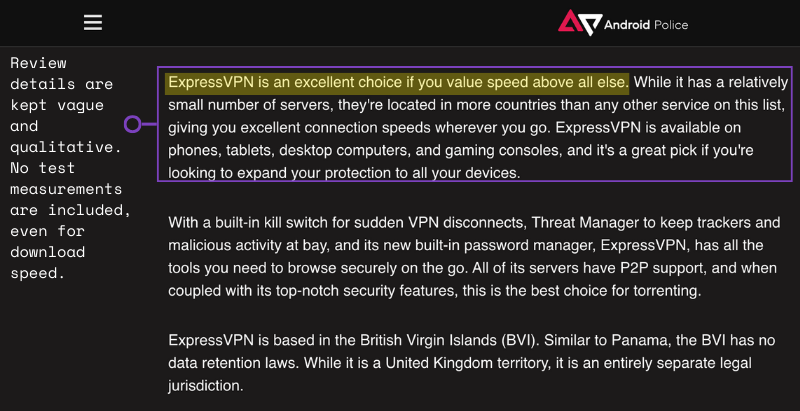
As you can see above, Android Police is doing the bare minimum with their VPN reviews, relying on specs to describe what the VPNs do. Reading through the guide feels more like skimming a collection of product listings than actual reviews. There’s no depth, no real analysis—just surface-level details.
Remember, Android Police is just one of Valnet’s four Fake Tester publications, with the other five we analyzed falling into the Not Trusted classification. Not a single one of their publications were labeled “Low Trust”.
The question is, can Valnet do anything to turn their brands and low-quality content around?
How Valnet Can Bounce Back
Valnet’s reviews are failing readers on nearly every front. Whether it’s Fake Testers misleading audiences with false claims or “honest” reviews that don’t fake testing lack depth and useful information, the result is the same: a loss of trust.
This isn’t just a problem—it’s a credibility crisis. To turn things around, Valnet needs to prioritize two key areas: transparency and effort.
First, stop faking testing. If a review claims to test, it should include measurable, quantitative results that back up those claims.
Second, for researched reviews, make them insightful and genuinely helpful. These should go beyond specs, offering detailed analysis and real value. Including original images—whether taken in-person or screenshots showing software or services in action—adds authenticity and trustworthiness.
Without these changes, Valnet risks losing what little trust they have left. It’s time for them to step up.
2.4. The Oldest Parent Company: Hearst Digital Media
Hearst is a truly massive publishing entity with a very long history that stretches all the way back to 1887. Every month, their network draws an impressive 307 million online visitors, making them one of the most influential players in the industry.
With ownership of over 175 online publications, Hearst ranks as the second-largest parent company in our dataset. But their history isn’t all positive. The founder, William Randolph Hearst, is infamous for his use of yellow journalism to build his empire. Today, Hearst Digital Media, their digital arm, seems to carry on that legacy, prioritizing sensationalism over substance.
Fake Testers dominate the Hearst publications we analyzed. Of the nine publications we reviewed, six were flagged for Fake Reviews. That’s a troubling statistic, especially considering Hearst’s enormous reach and the credibility its brands claim to uphold.
Here’s a closer look at the Trust Ratings for the nine Hearst publications we investigated.
The Trust Ratings for Hearst’s publications reveal widespread issues with credibility. Runner’s World leads with 59.98%, barely reaching “Low Trust,” while Car and Driver and Bicycling follow at 45.05% and 43.65%, failing to inspire confidence. Even Good Housekeeping, known for product recommendations, scores just 38.62% as a Fake Reviewer. At the lower end, Men’s Health has a shockingly low rating of 9.70%, highlighting the pervasive trust challenges within Hearst’s portfolio of brands.
Good Housekeeping stands out in particular. It’s been a trusted name for over a century, it’s famous for its product reviews and the iconic Good Housekeeping Seal is seen on store shelves.
So why does this reputable product reviewer have a 38.62% Trust Rating?
The Fall of Good Housekeeping
Good Housekeeping has long been a trusted name for consumers, offering advice on products since its founding in 1885—before Hearst even existed. But its legacy and iconic seal of reliability is taking a hit, with a failing average Trust Rating across nine categories we investigated.
The failures here are especially disappointing because Good Housekeeping was once a go-to for verifying product quality. They also heavily promote their unique testing labs as a cornerstone of their credibility, so the mediocre average Trust Rating and amount of fake testing we found were shocking to us.
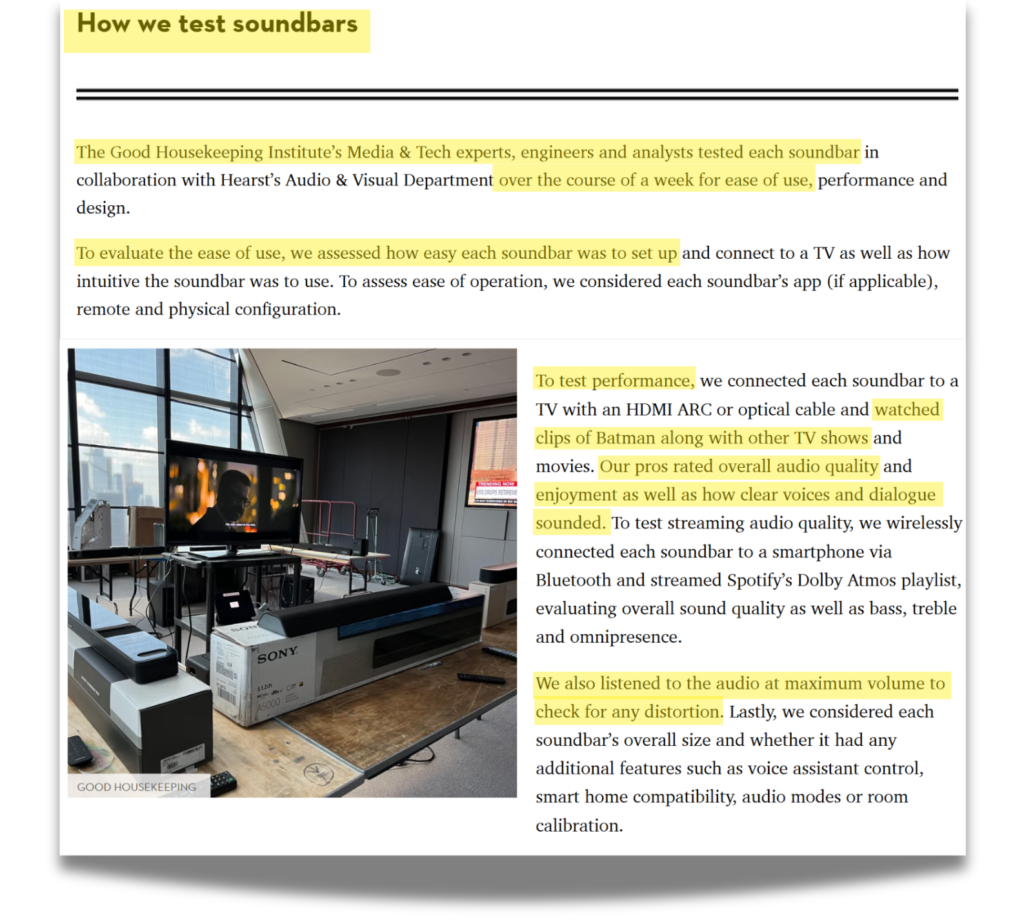
In regards to fake testing, take their soundbars guide for example in the screenshot below. They frequently mention their “testers” and testing, but there’s no actual data to back up their claims. No scores, no measurements—just vague statements like testers being “blown away” by sound quality.
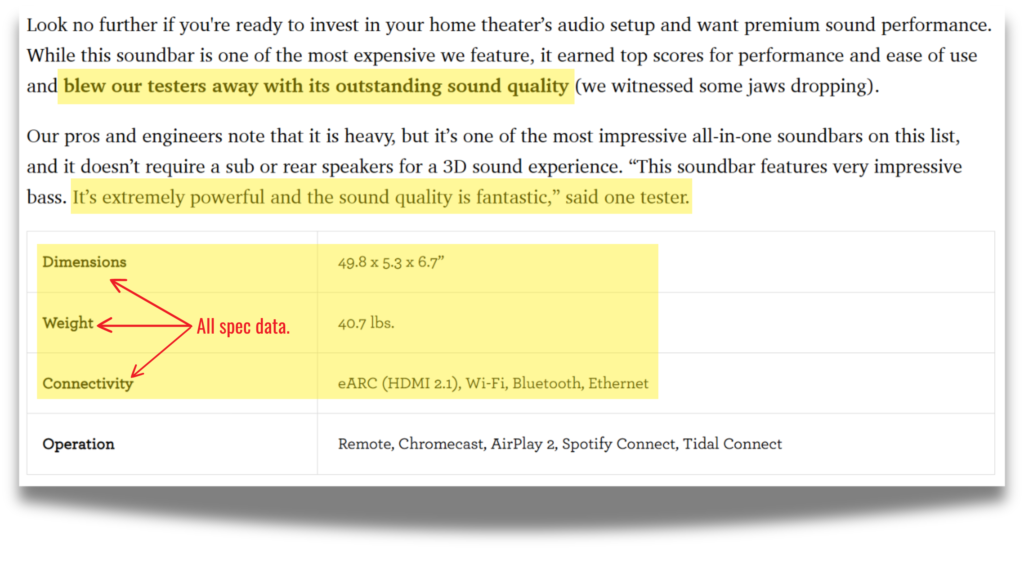
Who are these testers mentioned above? Do they have names? What soundbar testing tools were used? What data supports the claim that a soundbar’s sound is “fantastic” or “powerful”? There’s nothing on maximum volume or frequency response. It’s all fluff, accompanied by a small spec box that offers product details but no real testing insights.
Let’s address the next steps Hearst must make to restore trust in their reviews.
The corrections we demand from Hearst
Hearst has a chance to turn things around, but it requires real action. If the Good Housekeeping testing labs are functional, it’s time to prove it, along with the other Hearst brands.
Readers need to see measurable results—data like sound levels, frequency response, or speed tests. Without that proof, their testing claims feel hollow.
Visual evidence is just as important. Real images of products, videos of testing processes, and screenshots of testing software would add much-needed transparency.
Naming their testers and sharing their credentials would also go a long way in building trust.
And if no testing is actually happening? They need to stop pretending. Reviews labeled as “tested” should instead be called “researched” or “hands-on.” Honesty matters.
Good Housekeeping and other major Hearst brands have built their reputations on trust. Now, that trust is hanging by a thread. The fixes are simple, but they require effort. Without them, Hearst risks losing not just their credibility—but their audience, too.
2.5. The Most Well-Known Parent Company: Conde Nast
Condé Nast, founded in 1909, built its reputation on glamorous publications like Vogue but has since expanded into tech and food with brands like WIRED and Bon Appétit. Across its portfolio, Condé Nast attracts over 302 million visitors each month, a testament to its broad influence.
However, the trustworthiness of their reviews is another story.
In our dataset, we analyzed six of their publications, and the findings were troubling. Most of their traffic goes to Wired and Bon Appétit—two brands heavily plagued by fake reviews. This has dragged Condé Nast’s average Publication Trust Rating down to a failing 34.09%, far below the 60% benchmark for credibility.
Even their top performer, Ars Technica, narrowly misses a passing score at 59.48%, while Bon Appétit plummets to a dismal 16.15%. The rest, including WIRED and GQ, hover in the low 30s, revealing inconsistent and unreliable standards across their portfolio.
WIRED’s struggles are particularly concerning. As a long-established authority in tech, Wired has traditionally been trusted for insightful, well-tested reviews. Yet, their 32.36% Trust Rating tells a different story.
Their reviews often fail to back up testing claims with meaningful data, show limited real-world images of products, and over-rely on specs rather than genuine insights. This earns Wired the Fake Reviewer label across several categories, further tarnishing Condé Nast’s credibility.
WIRED’s Testing Claims Fall Apart Under Scrutiny
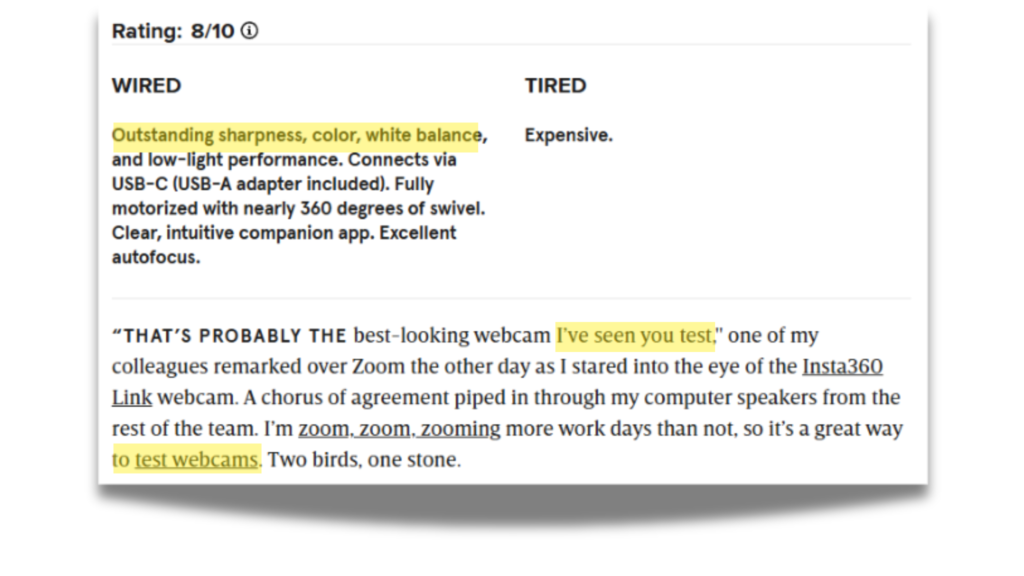
23 out of 26 of Wired’s categories we investigated earned a failing Trust Rating, like their webcam category (30.40% Trust Rating). The issues are glaring in their reviews, starting with a complete absence of custom imagery.
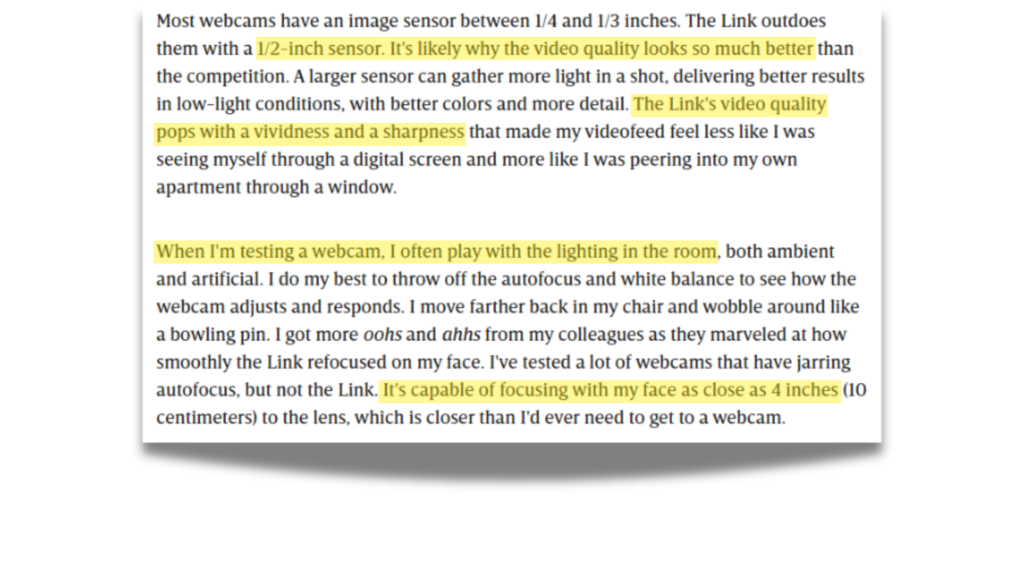
Consider this webcam review. It’s packed with claims of testing but offers no real proof. There are no photos of the webcam in use, no screenshots of the video quality it outputs, and not even a snippet of footage captured from it.
Simply put, there’s no data to lean into. No real measurements, nothing that suggests the use of actual testing equipment. Just qualitative assessment of a product.
Real-world use? Maybe, even that’s hard to confirm.
The pros section that they call “WIRED” (screenshotted below) mentions key performance criteria that make up webcam picture quality, implying they made detailed evaluations.
As you can see, Condé Nast’s trust problem is big, but it’s fixable.
How Conde Nast Can Rebuild Trust
The solution starts with transparency and honest communication. If they want to regain credibility, they need to make some changes to their review and editorial practices. They can take next steps similar to the previous four parent companies:
- They need to show their work. Testing claims mean nothing without proof. Reviews should include real data, like performance metrics, screenshots, or even videos of products in action. Custom images, not stock photos, should back up every claim. Readers need to see the tools, testers, and processes used. No more vague promises—just clear, measurable evidence.
- If a product hasn’t been tested, they need to say so. Misleading phrases like “tested” should be replaced with honest descriptions like “researched” or “hands-on.” Readers value transparency, even if it means admitting a review is less thorough.
For a company as big as Condé Nast, these changes aren’t just a suggestion—they’re a necessity. Readers are watching. Rebuilding trust starts with doing the work and showing the proof.
Conclusion: Fakery is Prominent in Big Media
None of the parent companies have a decent average Trust Rating, as you can see below. None of them break 45%, let alone 50%, which is a sign of major trust issues. This isn’t just a one-off issue—it’s a systemic problem across the board.
Parent Company Average Trust Ratings
The average Trust Rating for each parent company, calculated from their investigated publishers’ Trust Ratings.
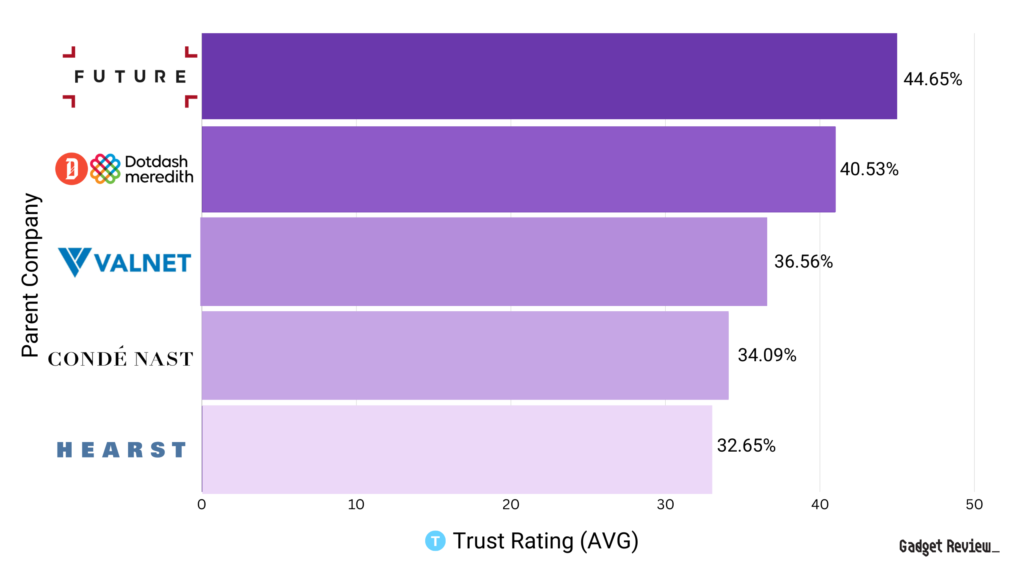
For readers, this means approaching any publication under these conglomerates with caution. Whether it’s TechRadar, Good Housekeeping, Wired, etc., their reviews often lack the rigor and transparency needed to earn trust. Until these companies prioritize real testing and honest reporting, relying on their scores and recommendations is a gamble.
The bottom line? Trust needs to be earned, and right now, these major parent companies aren’t doing enough to deserve it.
Now you’ve seen how the five biggest parent companies are deceiving their audiences as their brands pull in a staggering 1.88 billion visitors a month. But what about individual publishers? Who are the five biggest fakers?
3. The Fake Five: These “Trusted” Publishers are Faking Product Tests
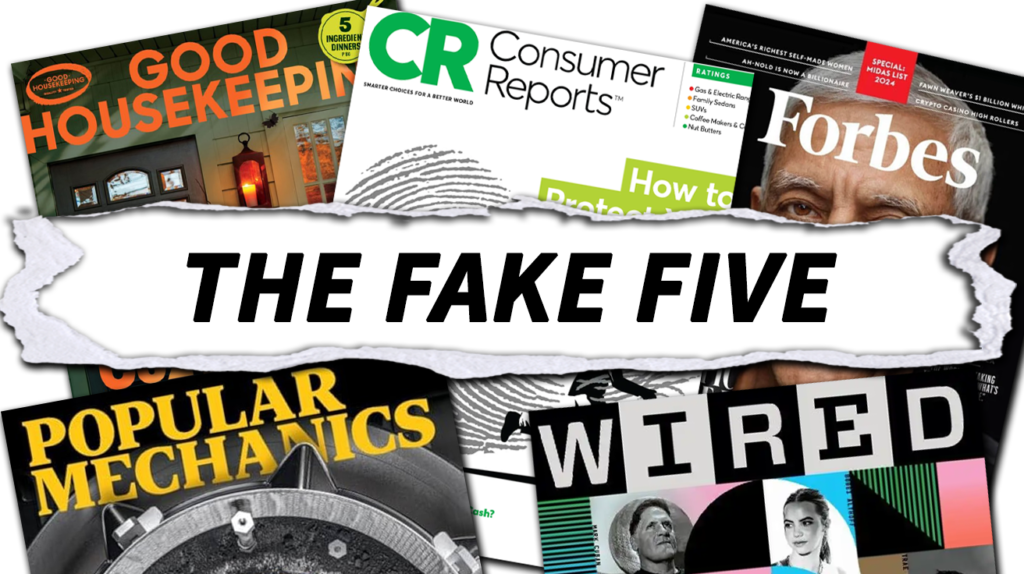
Millions of readers trust these five publications to guide their buying decisions, expecting reliable, data-backed recommendations. But what if that trust is misplaced? The truth is, some of the most famous, reputable names in the review industry are faking their testing claims.
Meet the Fake Five: Consumer Reports, Forbes, Good Housekeeping, Wired, and Popular Mechanics. Together, these five sites attract a staggering 259.76 million visitors a month—that’s 23% of all traffic in our dataset of 496 sites. A quarter of the total traffic is going to reviews with little to no evidence of real testing.
Four of these sites are veterans in the review space, making their shift to fake testing especially frustrating. Forbes, on the other hand, has weaponized its financial credibility to churn out commerce-driven reviews that trade trust for clicks.
Here’s an overview of how these five publications mislead their massive audiences while profiting from fake reviews.
Key Takeaways
- The Fall of Once-Trusted Tester Consumer Reports
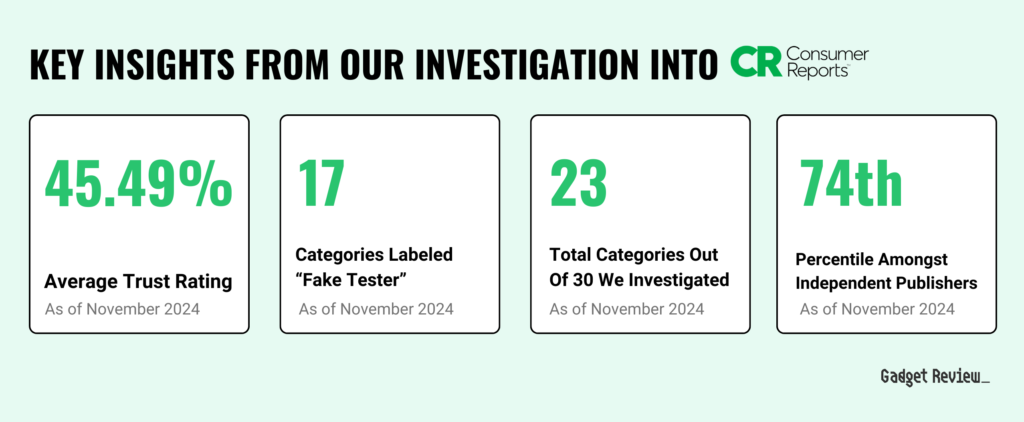
- Widespread Fake Reviews: Consumer Reports earned a “Fake Reviewer” classification in 17 out of the 23 categories we analyzed, with only three showing credible testing evidence.
- Failing Trust Rating: Despite its strong reputation and revenues, Consumer Reports scored just 45.49% on our Trust Rating, falling far below the benchmark for credible reviews.
- Duplicated Reviews & Lack of Transparency: Their reviews rely on vague scores, repetitive language, and cookie-cutter content across products, offering little measurable data or visual proof to support claims of rigorous testing.
- The Decline of Good Housekeeping’s Credibility
- Low Trust Rating Despite Test Labs: By earning a 38.62% Trust Rating in the 18 categories we evaluated, Good Housekeeping no longer lives up to the rigorous standards its seal once represented. The lack of quantitative test results, despite their renowned test labs, raises serious concerns about the rigor and honesty behind their reviews.
- Falling Short in Key Categories: Despite its reputation, Good Housekeeping barely passed in appliances like vacuums (61.40%) and e-bikes (61.53%), while categories like air purifiers (13.40%) and drones (20.20%) scored disastrously low.
- Popular Mechanics: A Legacy Losing Steam
- A Troubling Trust Rating: With a 28.27% Trust Rating, Popular Mechanics’ reviews fall far below expectations, undermining over a century of credibility. We trust them in only two (3D printers and e-scooters) out of the 24 categories we investigated.
- Widespread Fake Testing Concerns: Despite claiming to evaluate products in 13 categories, we found evidence of fake testing in 10 of them.
- WIRED: Tech “Expertise” Without the Testing Depth
- 🔍Lack of Transparency: Their reviews frequently omit critical testing data and real-world images, leaving readers questioning the thoroughness of their evaluations.
- Falling Credibility: WIRED earned a disappointing 32.36% Trust Rating across 26 categories we investigated.
- Forbes: Deceiving Their Massive Audience
- With 181 million monthly visitors, Forbes earns a Fake Reviewer classification, with a shocking 9 out of 27 categories we investigated featuring faked testing. They’re the most popular publisher out of the Fake Five. This level of traffic amplifies the impact of their misleading reviews, eroding trust in their once-reputable name.
- Barely Trusted in Anything: Earning an average 34.96% Trust Rating, Forbes’ non-financial reviews fail to uphold their credible legacy. We only trust them (barely) in 2 out of the 27 categories: e-scooters (62.60%) and routers (62.20%).
As you can see, the top five publications by traffic and fake testing paint a very troubling picture.
Here’s some more high-level information on them below, including their average Trust Rating, independence status, Trust Classification, and more. The list is in order of highest average Trust Ratings, with Consumer Reports in the lead.
Next we dig into these fakers and explain why they were labeled as Fake Testers to begin with.
3.1. Consumer Reports
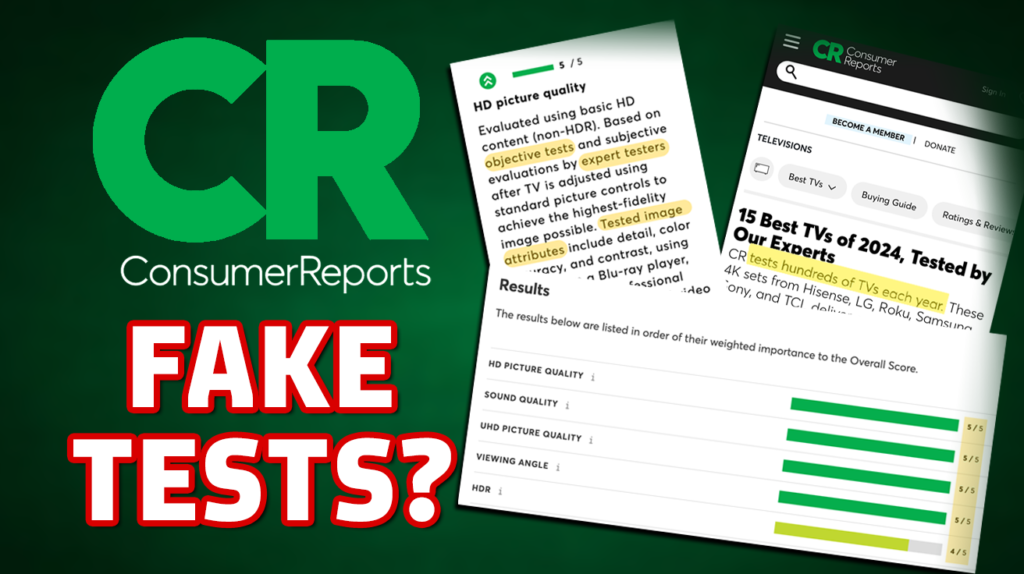
Many of you can remember a time when Consumer Reports was the trusted name in product reviews. Back then, if Consumer Reports gave a product the thumbs-up, you could buy with confidence. But these days, their reviews aren’t what they used to be.
As a nonprofit, they generate over $200 million annually, supported by nearly 3 million print magazine members and more than a dozen special-interest print titles covering autos, home appliances, health, and food.
With over 14 million monthly online visitors and 2.9 million paying members, they’ve built a massive audience—and they’re taking advantage of it.
Their content is distributed across multiple platforms, including mobile apps and social media channels.
Nowadays, there’s so much circumstantial evidence indicating that Consumer Reports hides their test results and duplicates their reviews across different products. And their disappointing 45.49% Publication Trust Rating reflects that.
While their car reviews are still pretty reliable, other product reviews and buying guides in other categories lack the in-depth test evidence that once distinguished Consumer Reports.
We reached out to Consumer Reports in December 2023, and we learned that they’ll give the actual test results if you contact them for the data. So the testing is happening, but getting that information is very inconvenient.
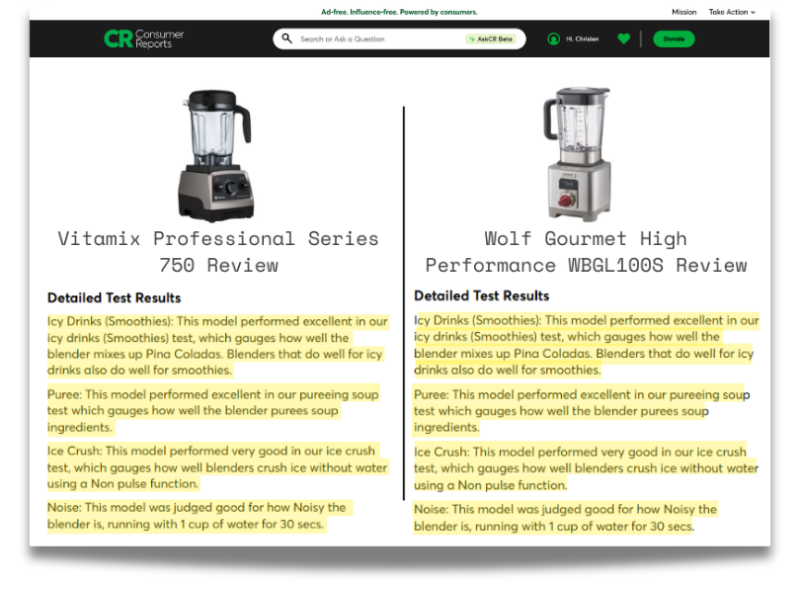
Many reviews are templatized, repeating the same sentences across different products’ reviews. See how these blender reviews for the Vitamix Professional Series 750 and the Wolf Gourmet High Performance WBGL100S have the exact same written review below?
And on top of duplicated reviews, little to no visible test results to back up their claims make Consumer Reports’ reviews unreliable.
Subscribers shouldn’t be receiving these basic reviews nor have to jump through hoops to see the test results—especially when Consumer Reports used to set the standard for transparency and detailed product reviews.
Look at their TV reviews for example, a category which earned a failing 47.60% Trust Rating.
Their TV testing seems non-existent.
TVs are the most difficult product category to test. It’s also expensive to afford all the proper test equipment, which probably isn’t an issue for Consumer Reports. However, why did they get that terrible 35.40% Trust Rating? Here’s their “Best TV” buying guide first.
Immediately in the subheadline, you see the author James K. Wilcox state that Consumer Reports tests a huge amount of TVs every year.
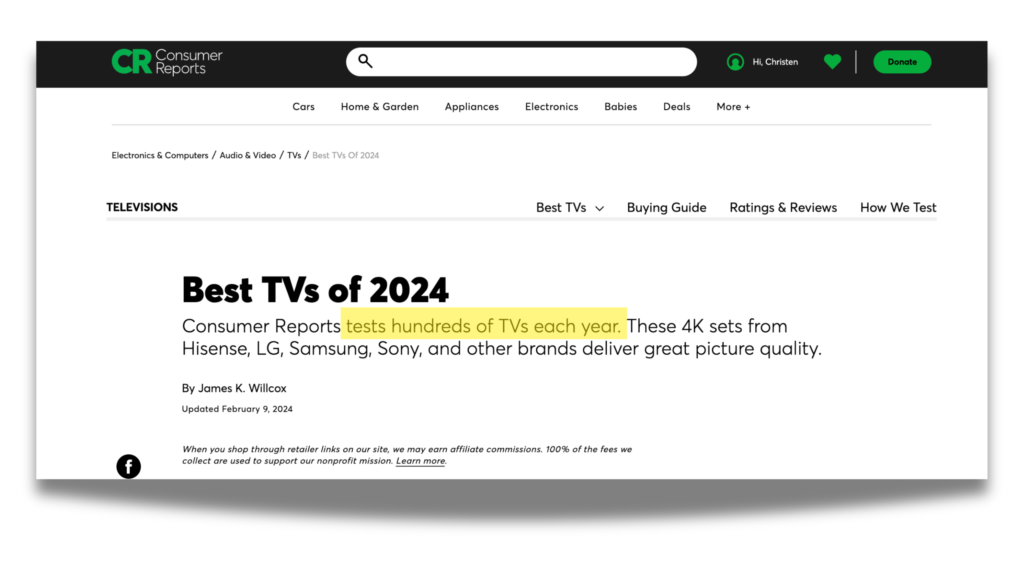
By seeing that subheadline, a reader expects to see test results in this TV buying guide from the best product testers in the world.
And even worse, their reviews are presented in this cookie cutter format that use templatized language.
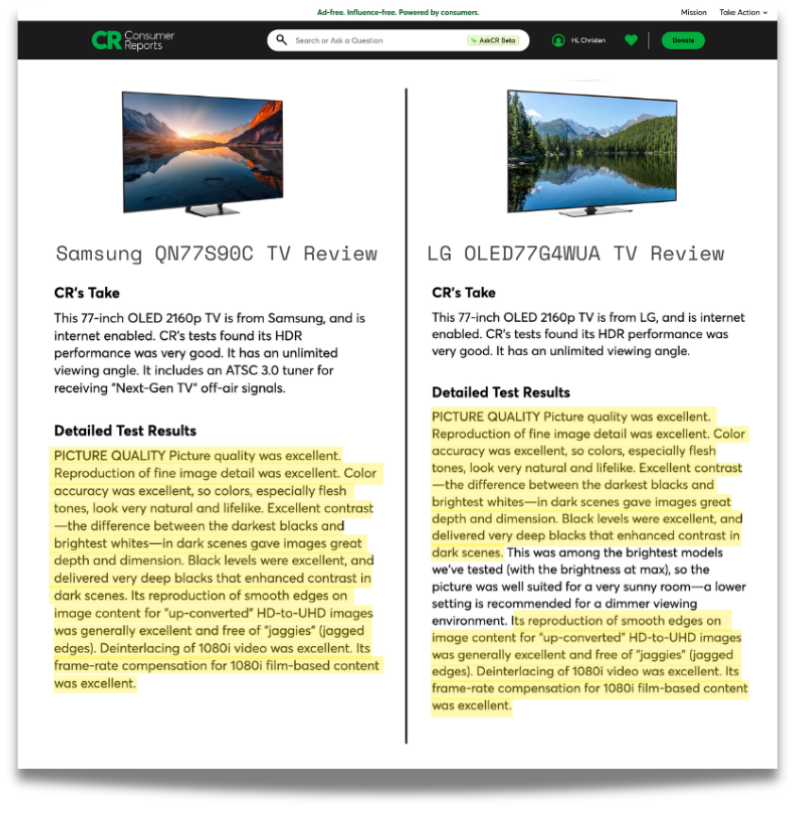
Blenders was the worst case of these tokenized reviews that we came across. Check out the reviews for the Vitamix Professional Series 750 and the Wolf Gourmet High Performance WBGL100S below. The “Detailed Test results” Sections? Exact duplicates, as you can see by the highlighted parts.

It seems whoever put these reviews together didn’t even try to change the wording up between the reviews.
Still don’t believe us? Take a look at these other sections reviews and see for yourself.
And again, it’s not just TVs that’s the problem area in CR. Take a look at some other categories where they claim to test despite publishing vague product reviews with no test results. The claim that they test products stands out most on pages where they ask for donations or memberships.
Their router reviews aren’t helpful either.
Routers is another problematic category with hidden test results and duplicated reviews. This category earned a pretty bad 45.20% Trust Rating. Click the “SHOW MORE +” below to expand this section to read it.
Let’s take a look at the top of a single product review this time.
There aren’t any bold testing claims at the top of the review page for CR, unlike other sites.
But as you scroll, you’ll see the same Ratings Scorecard with the basic 5-point scoring system that they call “test results”.
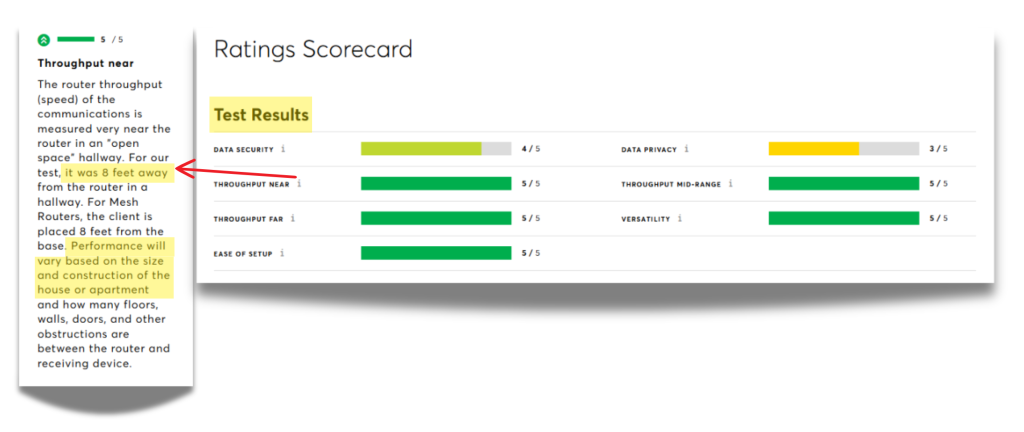
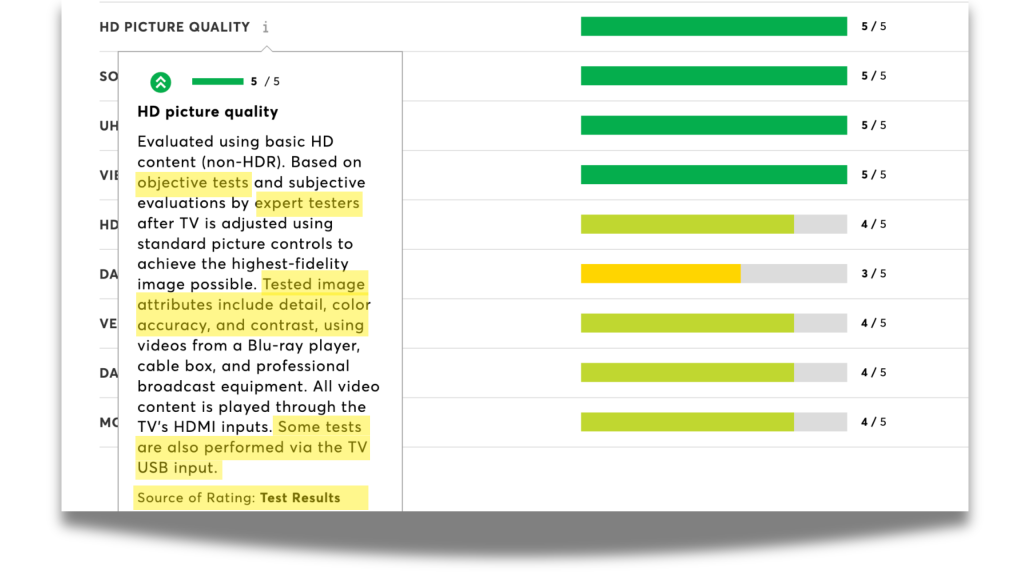
Like we saw with how CR handled televisions, the test results section for their router reviews follows a very similar structure. Lots of different criteria are examined and supposedly tested and that’s how an item receives scores out of five per criteria. Unfortunately, the tooltips contain no useful information – just further explanation on what makes up any given test criteria without actually providing test results.
If you keep scrolling, you’ll see that the detailed test results for routers are even more anemic than they were for televisions.

There isn’t much to go off of here beyond qualitative explanations of how the router performed. There’s no information about actual download speeds, upload speeds, latency, or range testing.
Show more +Misleading Membership and Donation Pages Where They Claim They Test
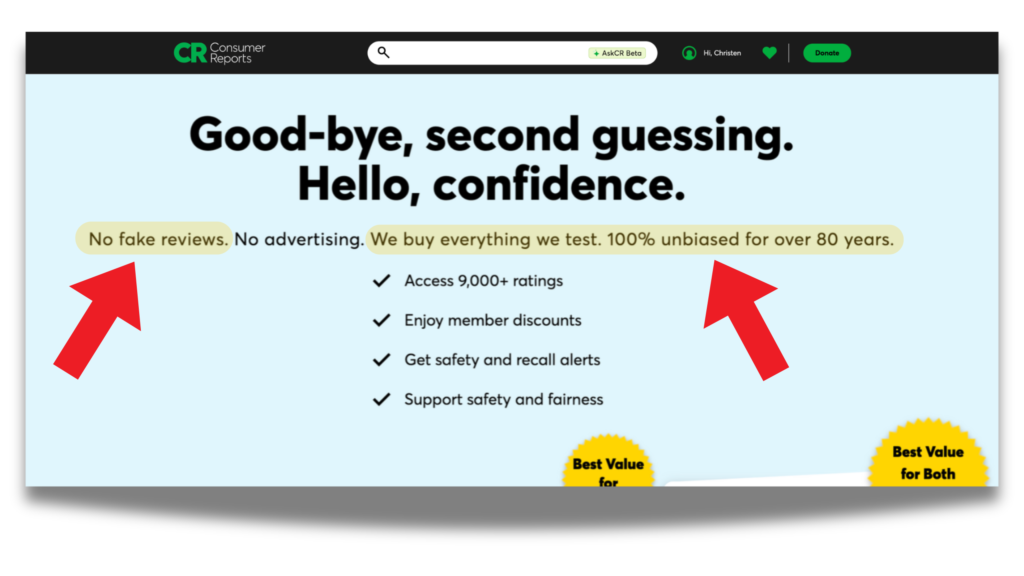
To top it all off, Consumer Reports promotes their product testing across their website, including pages where they solicit donations or memberships. Again, click the “SHOW MORE +” to read this section.
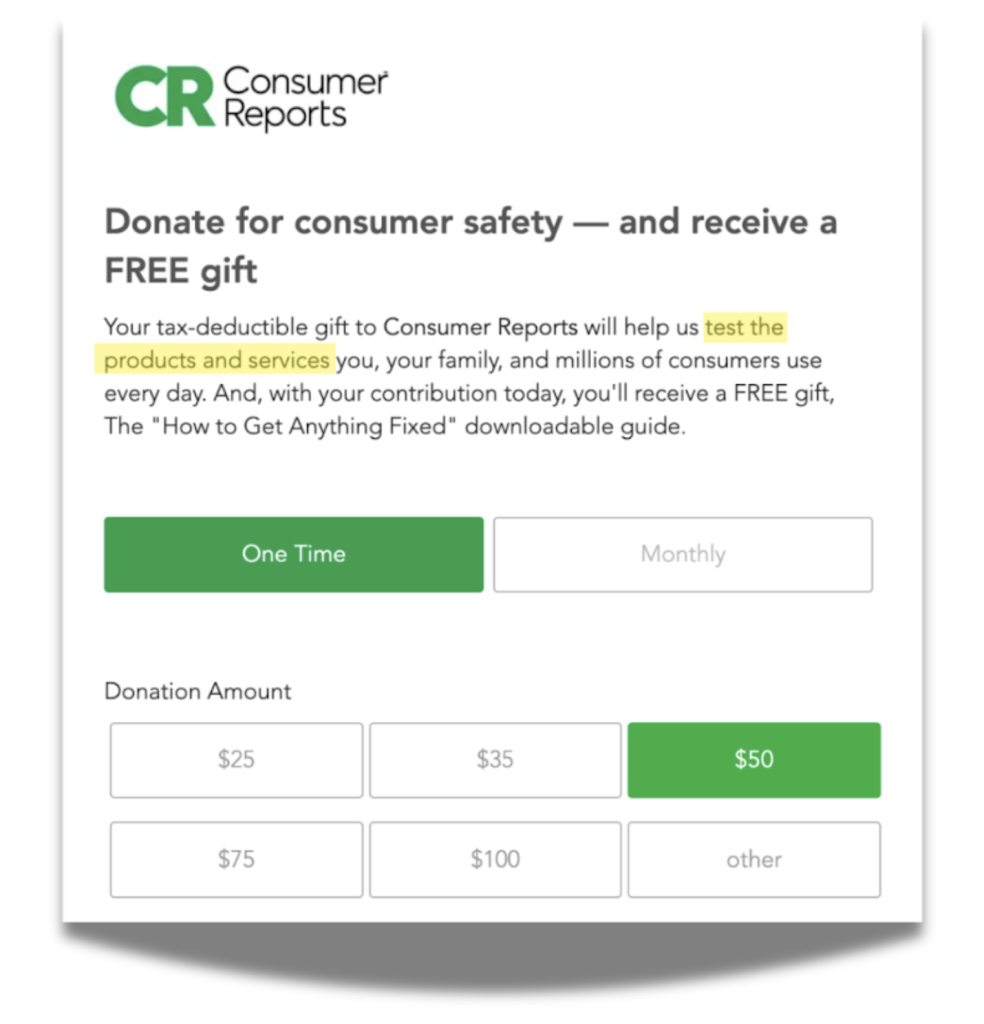
This emphasis on rigorous testing is out of sync with their anemic review content and lack of test data.
Show more +The Corrections We Demand from Consumer Reports
For a brand that built its name on transparency, having to jump through hoops to get actual test results is frustrating and bizarre.
People expect real, tested insights—not vague claims or recycled templates. And when that trust cracks, it’s hard to rebuild.
If Consumer Reports doesn’t change course, they risk losing what made them different: the confidence readers felt knowing they were getting honest, thorough advice. Without that trust, what’s left? Just another review site in a crowded field.
The corrections we demand? Show the test results and stop copying and pasting the same basic paragraphs across different product reviews. Give users access to real numbers, side-by-side product comparisons, and actually helpful reviews.
That’s how Consumer Reports can reclaim its place as a reliable source and boost their Trust Ratings. Because trust comes from transparency, not just from a good reputation.
3.2. Good Housekeeping
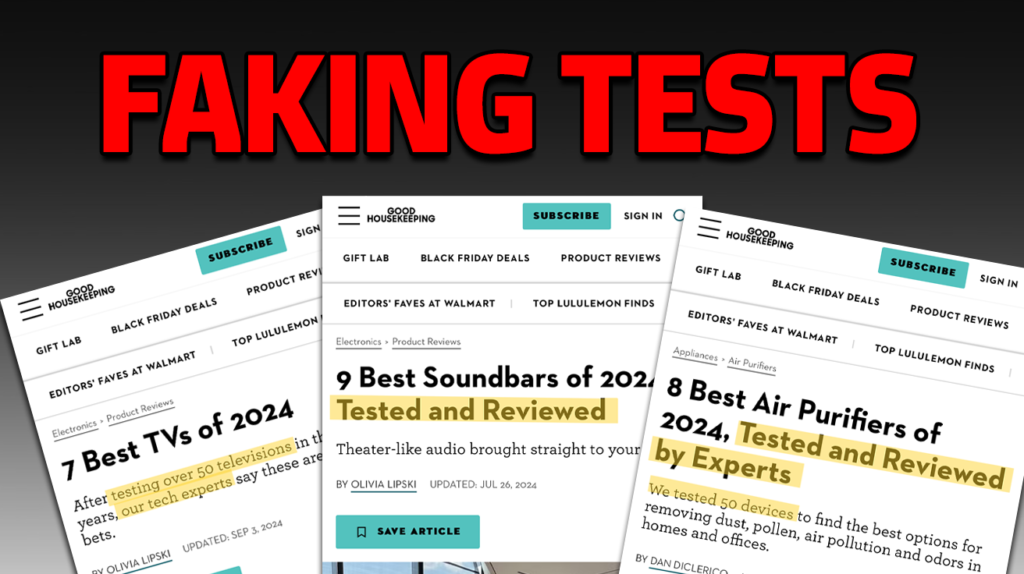
If you’ve ever grabbed a product off the shelf with the Good Housekeeping Seal on it, you know the feeling. That seal wasn’t just a logo—it was a promise.
It meant the product had been rigorously tested by the experts at the Good Housekeeping Institute, giving you peace of mind, right there in the store aisle. But things aren’t the same anymore.
What used to be a symbol of trust now feels like it’s losing its edge. Since 1885, Good Housekeeping has been a trusted name in home appliances, beauty products, and more.
With 4.3 million print subscribers and 28.80 million online visitors every month, they’ve built a reputation that millions have relied on. And now they’re taking advantage of that trust and cutting corners in their reviews.
Good Housekeeping has a similar story to Consumer Reports–it seems they’re hiding the test results, which is a big reason for their awful 38.62% Trust Rating across 23 categories we evaluated.
For a brand that once set the gold standard in product testing, this shift hits hard. Without the transparency they were known for, it’s hard to trust their recommendations. And that’s a tough pill to swallow for a name that’s been synonymous with reliability for over a century.
The way that Good Housekeeping (54.8M monthly views) handled their TV reviews is part of what spurred the intense analysis we started performing on product review testing: their testing claims didn’t reflect in the text they were publishing.
But the problems don’t stop at TVs – out of the 16 categories they claim to test, 11 were found to have faked testing. One of them is soundbars, which we dive into in the next section.
Their Surface-Level Soundbar Reviews
Good Housekeeping (GH) soundbar reviews earned them a rough 33.70%. How did this happen?
We’ll start with their “Best Soundbars” buying guide. GH makes an immediate claim about their testing in the title of the post, and has an additional blurb about it down below the featured image.
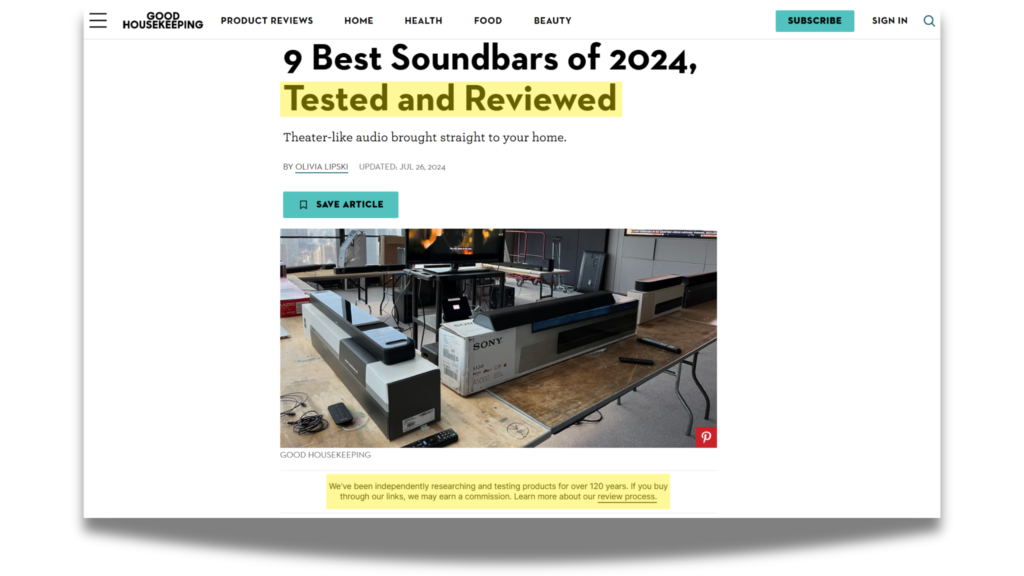
The expectation is clear: these 9 soundbars have supposedly been tested.
And once again, this isn’t the only category with substantial evidence pointing to fake testing.
Same Story with their Unhelpful TV Reviews

These unreliable reviews are a pattern across many of Good Housekeeping’s categories. Take their TV category for example. TVs received an even worse Trust Rating of 21.70% than their soundbar reviews. Click the “SHOW MORE +” below to read this section about their “Best TV” buying guide.
The title doesn’t make any claims, so there’s nothing particularly out of place or unusual here.
The “How We Test” blurb makes a mountain of promises. Everything from measuring brightness with industry-standard patterns to investigating sound quality to look for “cinema-like” sound is mentioned. GH also notes they care a lot about qualitative performance criteria, in addition to the hard and fast numbers of things like brightness. Ease of use in day-to-day interactions with the TV is also part of their testing process. This is nice, but a TV that is great to use and extremely dim is not a particularly good television.
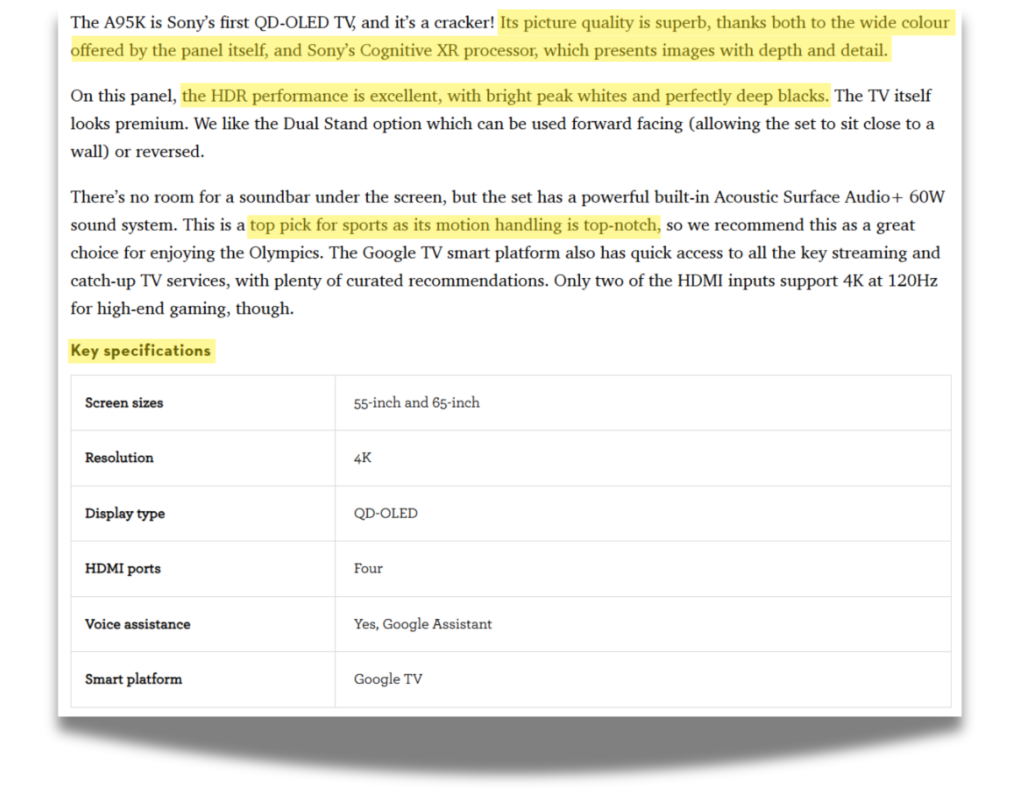
There isn’t much of use when you get to the actual review text, though. Beyond explanations of how good the TV looks (which is purely qualitative) there’s no data that suggests they actually tested. Mentioning how wide the color space is indicates they tested the gamut – but there’s nothing to suggest they did, because there’s no percentages given or gamuts mentioned. Bright whites, deep blacks – there’s no data to support this and no images either.
Show more +What Corrections Good Housekeeping Needs To Make
The trust Good Housekeeping has spent generations building is at risk here. With a 38.62% average Trust Rating, there’s a clear gap between the testing they claim to do and the evidence they provide.
If they can’t start showing their work—they need to get real about where thorough testing happens and where it doesn’t.
If they can’t provide hard data, they need to state that their review is based on “research” instead of “testing.”
In some categories, like e-bikes and routers, their testing holds up. But in others—like air purifiers and Bluetooth speakers—it’s hard to tell if the products were actually put to the test.
Like Consumer Reports, Good Housekeeping has spent decades earning consumer trust. But leaning on that trust without delivering transparency is a risky move.
They could jeopardize the reputation they’ve built over the last century. And once trust is broken, it’s hard to win back.
3.3. Popular Mechanics
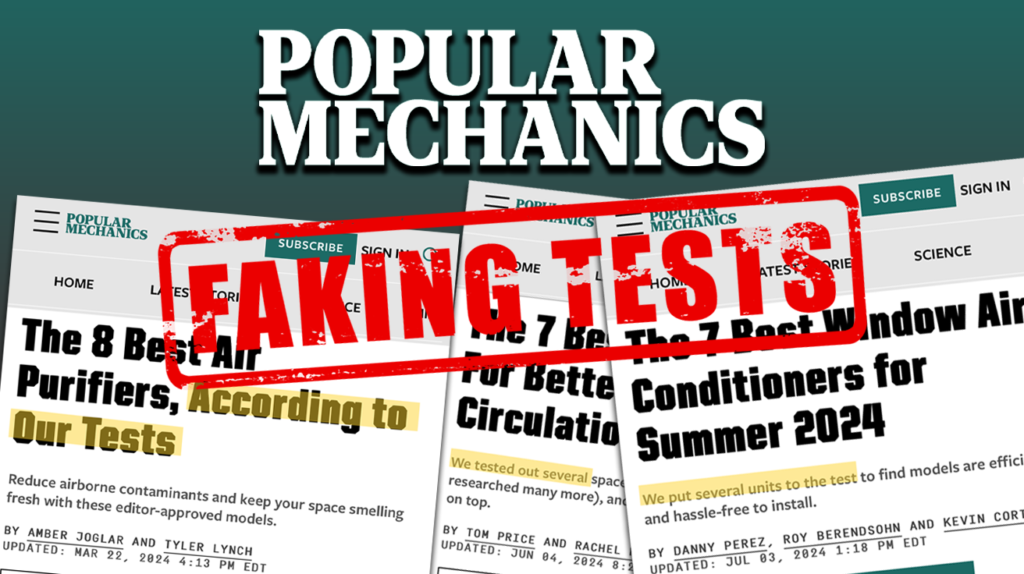
Popular Mechanics has been a staple in science and tech since 1902, known for its no-nonsense, hands-on advice and practical take on how things work.
With a total reach of 17.5 million readers in 2023—split between 11.9 million digital readers and 5.69 million print subscribers—it’s clear that they’ve got a loyal following. Every month, their website pulls in 15.23 million online visitors, all eager for insights on the latest tech, from 3D printers and gaming gear to electric bikes and home gadgets.
But lately, there’s been a shift.
Despite their history and resources, many of Popular Mechanics’ product reviews don’t quite measure up. They often skip the in-depth testing data that today’s readers are looking for, leaving a gap between their testing claims and the proof behind them.
This has landed them a disappointing average Trust Rating of 28.27% across the 24 categories we investigated, raising doubts about the depth of their reviews. For a brand with over a century of credibility, this shift makes you wonder if they’re still delivering the level of rigor that their readers expect.
What do we mean by fraudulent testing in the case of Pop Mech? Look at a few categories, like air conditioners to start.
Their Fake-Tested Air Conditioners Category
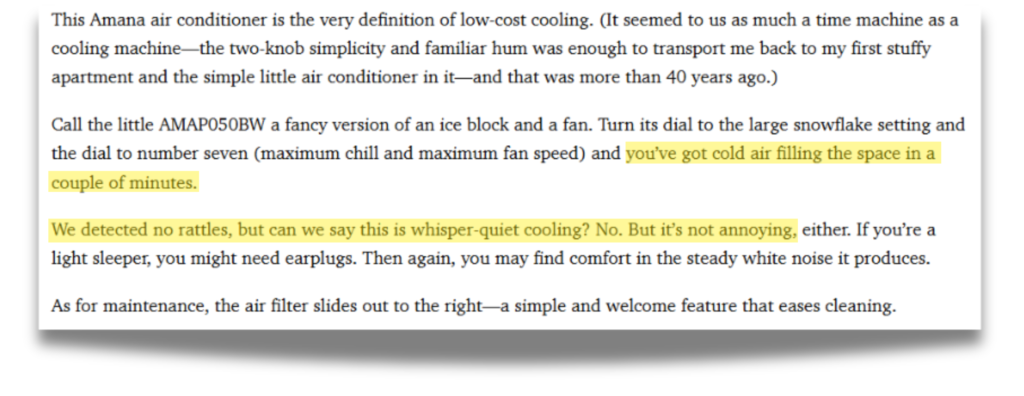
Pop Mech’s air conditioners category earned a terrible 41.35% Trust Rating, the highest out of all their fake tested categories. To test this category well, it’s important to measure how long a unit takes to cool a space in seconds or minutes.
Take a look at their “Best Window Air Conditioner” guide.


Popular Mechanics makes claims to test right in the subheadline of their guide and has a dedicated “Why Trust Us?” blurb that covers their commitment to testing, which we show above.
We also never found a dedicated air conditioner testing methodology, further hinting that their AC testing claims are fraudulent.
We saw the same fakery demonstrated in their vacuums category.
More Fraudulent Reviews in Vacuums
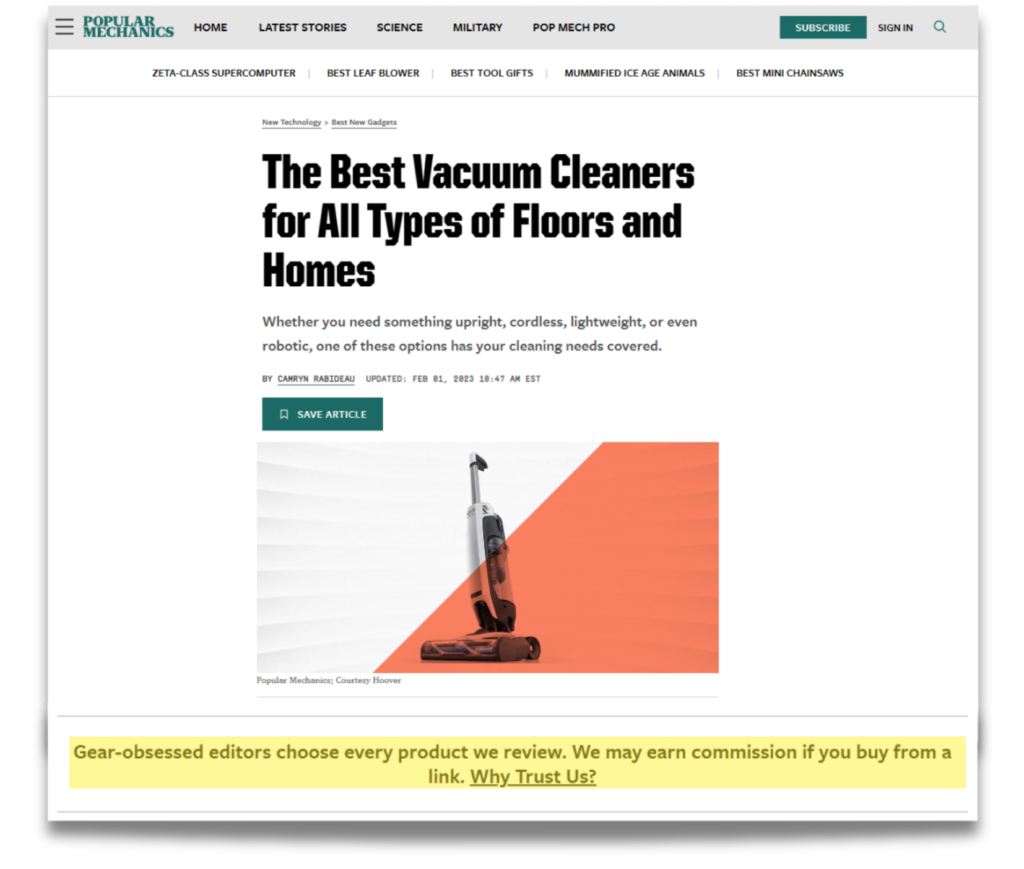
Vacuum cleaners is another fake tested category, where Pop Mech earned a mediocre 32.55% Trust Rating. We investigated their “Best Vacuum Cleaners” guide.
Popular Mechanics doesn’t make a testing claim this time, but their dedicated “Why Trust Us?” blurb leads to a page about their commitment to testing.
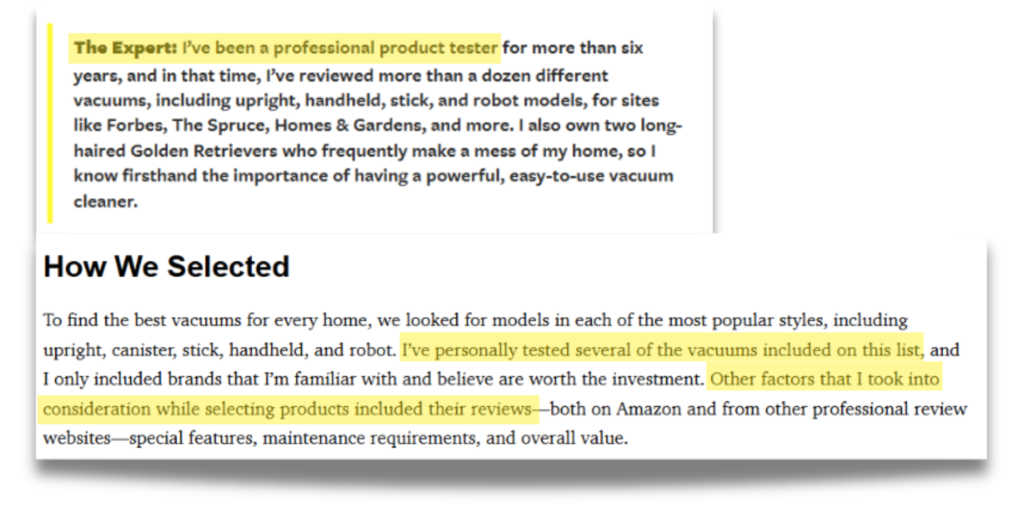
This time around, Popular Mechanics has dedicated space to the expert that is reviewing the vacuum cleaners, who is also making claims about testing a wide variety of vacuum cleaners. Models that were included on the list include “several” vacuums that the expert personally tested. “Several” is an important word here, because it means that not every vacuum on the list has been personally tested. In fact, “several” don’t even mean that most of them were tested. Including review data to help make picks isn’t bad.
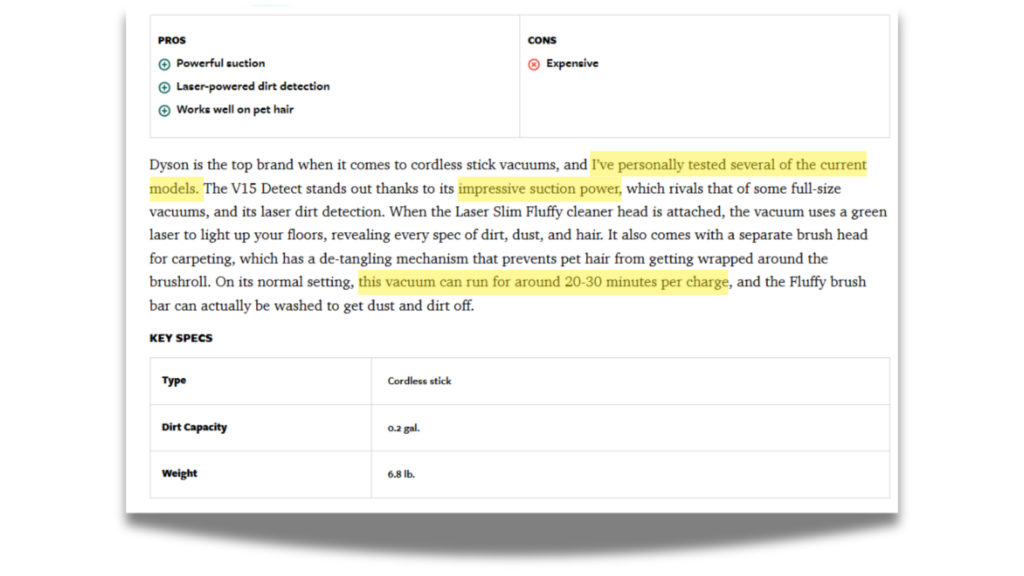
There’s a lot in this image, but all of comes down to one thing: there’s no test data. Despite claims of personally testing the vacuum, there’s nothing in the actual guide to suggest they did. Where’s the data on how much noise the vacuum makes? How much debris it picks up or leave behind? Even the battery life, something that requires nothing more than a stopwatch, isn’t given an exact measurement, and instead is given a rough approximation. Sure, the battery can be variable, but tests can be run multiple times to get average battery life, and we don’t see that here.
Show more +So what’s next for Pop Mech?
Pop Mech does a poor job of living up to their testing claims because there isn’t anything on the page that really hammers home that they did their homework and tested everything they said they tested. This ultimately damages Pop Mech’s authority in practical, hands-on advice.
To regain trust, they should commit to sharing clear, quantitative results from their product testing, making sure that their readers know exactly how a product performs. Otherwise, we ask them to change their “testing” claims to “researched”.
Coasting on your reputation as a trusted source and just letting your reviews begin to decay is exploitative, and means you’re just cashing in public trust and goodwill for an easy paycheck.
Fixing this problem doesn’t have to be difficult. But the choice is theirs on how or even if they decide to fix this massive breach of trust.
3.4. WIRED
If you’ve searched for the latest tech trends, you’ve probably run into WIRED. Since 1993, WIRED has made a name for itself as a go-to source for everything from the newest gadgets to deep dives into culture and science.
With 21.81 million visitors a month, WIRED reaches a huge audience, shaping opinions on everything from the latest gadgets to where artificial intelligence is headed.
They cover everything from laptops and gaming gear to electric bikes and smart home devices, making them a go-to for tech enthusiasts.
The problem is, despite their influence, a lot of WIRED’s reviews don’t dig as deep as today’s readers expect. With a 32.36% Trust Rating across 26 categories we investigated, their recommendations don’t exactly inspire confidence.
Their reviews often skip key testing data or even real-world images of the products they claim to test, leaving us wondering just how thoroughly these products were reviewed.
It’s not uncommon to see their reviews skip out on hard testing data or even real-world images of the products they claim to put through their paces.
Let’s examine a few of WIRED’s fake-tested categories to see exactly what fake testing looks like in their reviews.
Fakery in their Gaming Mouse Reviews
WIRED earned an abysmal 18.00% Trust Rating in the gaming mouse category, landing them a Fake Tester classification.
Our investigation focused on their “Best Mouse” guide (screenshotted below), which revealed significant trust issues.

The authors Eric Ravenscraft and Jaina Grey make a testing claim right in the subheadline above. Immediately, we expect to find test results in the guide. But as we read through the guide, we can’t find any test results.
Just like gaming mice, webcams was another disappointing category with fake testing claims.
WIRED’s Unhelpful Webcam Reviews
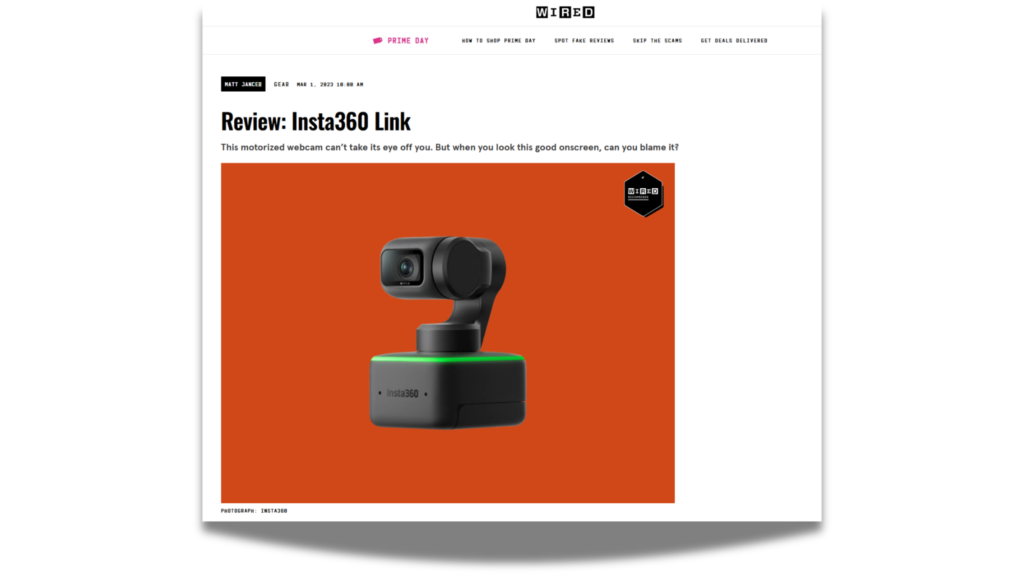
Let’s look at WIRED’s webcam reviews, another fraudulent category. This one’s trust rating wasn’t as low as gaming mice, but it’s still a failing score (30.40%).
The Insta360 Link review we investigated fell short in several areas.
The top of the page doesn’t show us any testing claims, just a basic subheadline, and a nice opening image.

The testing claims roll in once we hit the opening paragraph, and they’re even comparative in nature, with the testing claims suggesting the camera is among the nicest of the ones they’ve tested. The pros section suggests testing too, with key performance criteria mentioned. Despite what the “test webcams” link might have you think in context, it’s actually a link to a “best webcam” guide, not to a testing methodology.

Multiple highlighted portions in this paragraph all suggest not only usage but clear testing. The autofocus in particular, one of the most important aspects of a webcam, is put through its paces and does an excellent job of maintaining focus up to 4 inch away – or so the reviewer claims. But there’s no imagery to showcase this.
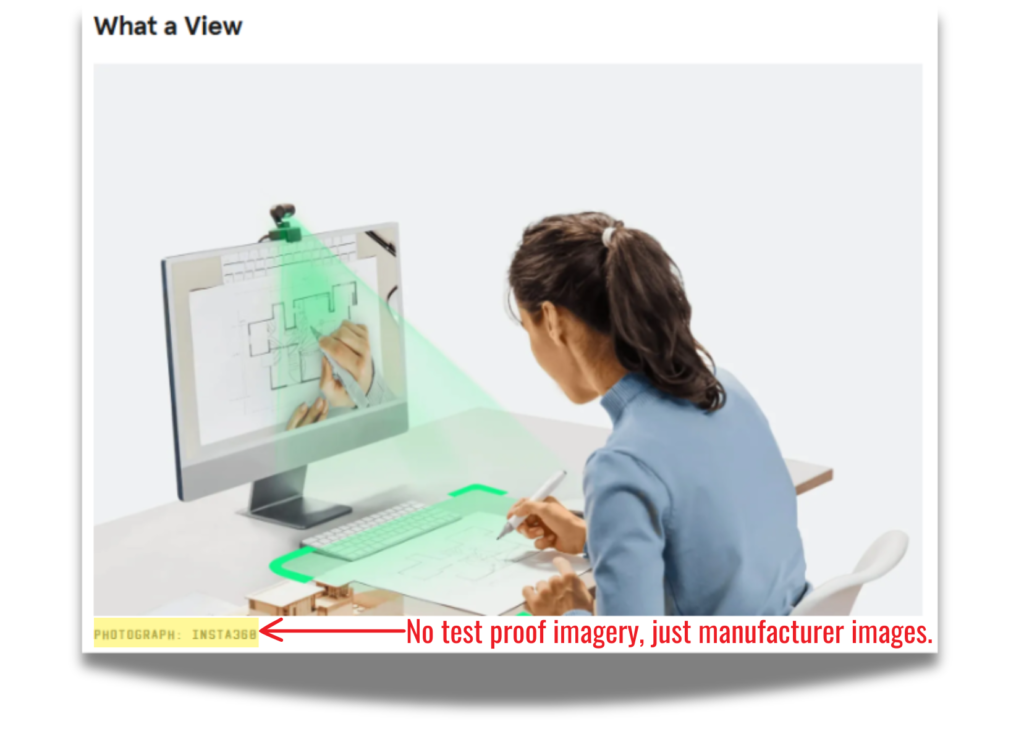
Instead of imagery that gives us an idea of how the camera performs (for example, showing off the excellent autofocus), we instead just get stock images from the manufacturer. This doesn’t build a convincing case for the testing claims that Wired is making in this review, and it casts serious doubt over the whole review. While the text suggests that the webcam may have been used, the total lack of any kind of testing imagery and data makes it very hard to believe.
Show more +The Next Steps for WIRED
For a brand that’s all about tech deep-dives, WIRED has some serious issues in how it backs up its product reviews, and with its 32.36% Trust Rating, the gaps are starting to show.
To get back on track, WIRED should bringing more transparency into their testing—think real photos (without the unhelpful colorful backgrounds), hard data, named equipment, and detailed testing processes.
This would help them reconnect with readers who want the facts to make smarter buying decisions.
3.5. Forbes
Forbes, founded in 1917 by B.C. Forbes, has been a cornerstone of financial journalism for over a century, renowned for its trustworthy coverage of finance, industry, and business.
The magazine earned credibility with business professionals through initiatives like the “Forbes Richest 400” and by maintaining high standards of factual accuracy.
However, over the past five years, Forbes made a calculated move to leverage its brand equity and trust to gain prominent placement in Google’s search results, expanding into areas like “best CBD gummies” and “best gaming TVs.”
This strategy, known as “parasite SEO,” has led to reviews that lack the depth and expertise Forbes is known for, earning them a terrible Publication Trust Rating of 34.96% (out of the 27 categories we investigated) that raises concerns about the credibility of their non-financial content.
Too often is Forbes claiming to test without actually backing up their test claims, and if they want their product reviews to have the same authority as their financial coverage, there’s a lot of work to be done.
Testing, providing imagery to prove testing, real measurements, solid analysis – it’s a hard road to legitimacy, but worth walking it when everyone stands to gain from it.
Their Terrible Fake-Tested TV Reviews
Forbes’ TV reviews earned a 18.20% Trust Rating, placing this category squarely in the Fake Tester category.
To uncover why, we examined their “Best Gaming TVs” guide (featured below), which revealed glaring issues in trustworthiness.
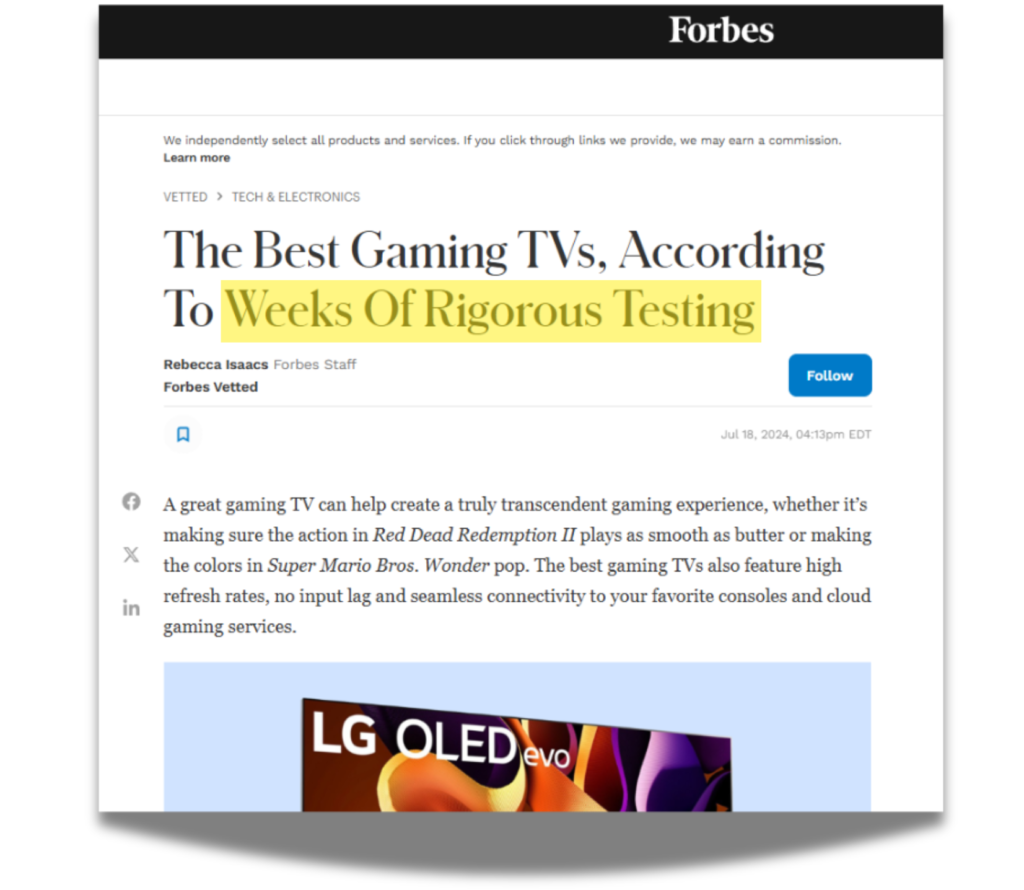
This testing claim is right in the title, front and center, so everyone can see it. Keep scrolling down to get into the individual reviews.
Gaming headsets is another category plagued by substantial evidence of fake testing, often misleading readers with eye-catching test claims in the title.
Same Disappointing Story with Forbes’ Gaming Headset Reviews
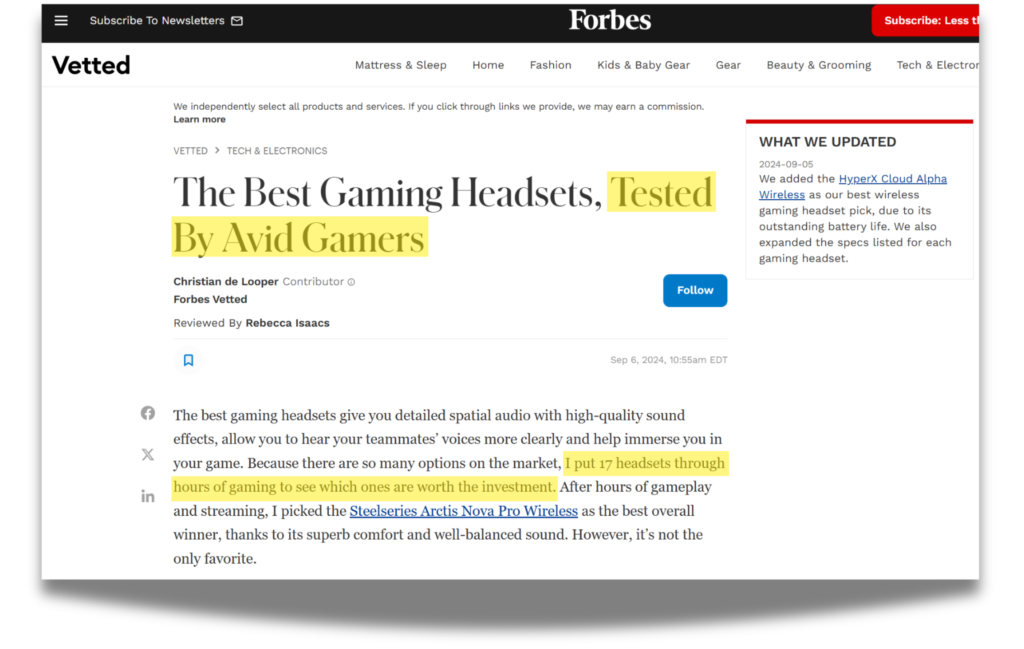
Another category with significant signs of fake testing is gaming headsets, which earned a 30.60% trust rating. Let’s look at their gaming headset buying guide below.
The testing claim from Forbes is (once again) right in the title of the post. Forbes even makes the claim that they’ve put these headsets through their paces. Unfortunately, using a headset for hours isjn’t quite the same as testing it – at least not entirely. There’s plenty you can learn about from a headset by using it, especially given how much things like sound are a matter of taste, but other things like maximum volume and latency are firmly in the realm of measured testing, not simply using a headset while you play a few matches of CoD.
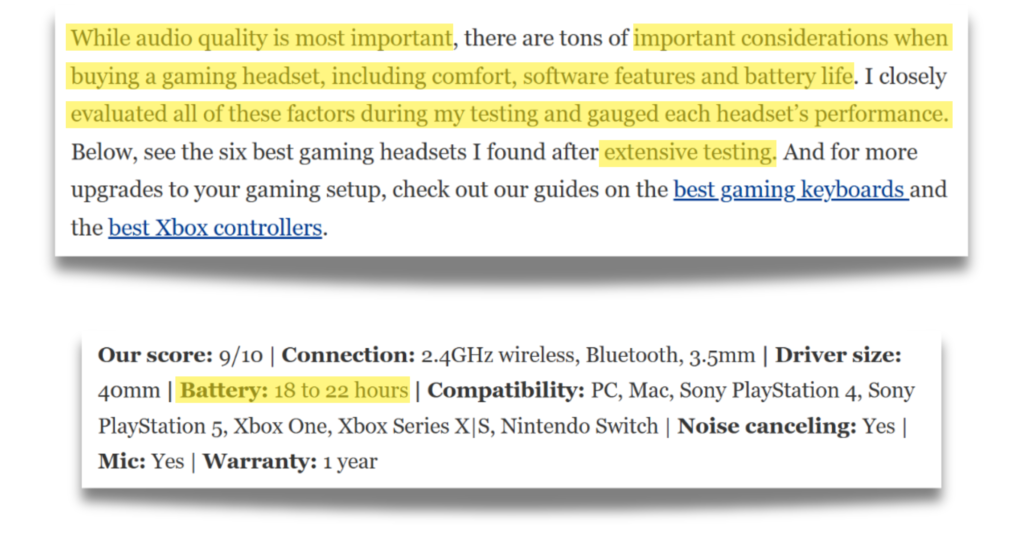
The first red flag comes up with the battery life. After stating how important battery life is, we simply get estimates on battery life, instead of actual testing data that shows how long the battery lasted. And for how much the reviewer talked about how important so many factors of the headset were, to get not only an approximation of the battery life, but also no further concrete numbers (like maximum volume) is disheartening.
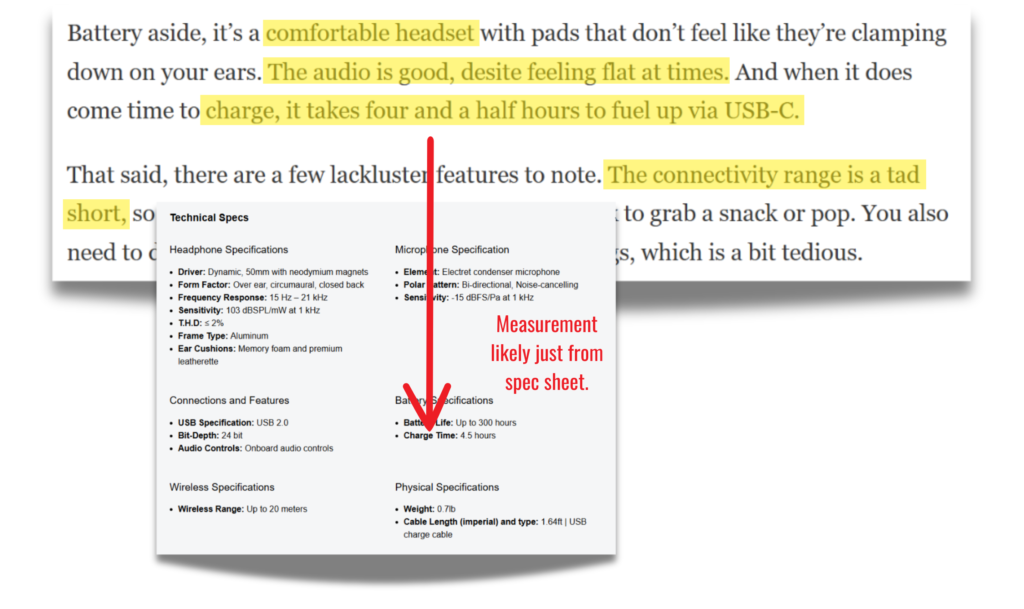
Ultimately, the biggest issue is the lack of measurements from Forbes. For all the subjective qualities a headset has (microphone quality, sound quality, comfort, feel) there are multiple objective qualities that require testing to determine. Battery life, latency, and range are all objectively measurable, but no data is provided. How far can you go with the headset before it cuts out? Without the data, it’s hard to say that Forbes actually tested any of the headsets it claims to have spent so much time on – though they definitely did use them. Even when Forbes seems to be providing an actual measurement (like charge time) the numbers match up one to one with what’s listed in a spec sheet from HyperX.
Show more +The Corrections Forbes Needs To Make
Forbes has a lot of work to do.
Not only do they have a substantial number of categories they’re faking, they’re simply not in the majority of the categories they cover with their reviews, which means they have to ramp up testing across the board.
Alternatively, they could simply stop claiming to test altogether and instead note that they’re publishing “first impressions” reviews or simply research reviews based on data from around the web. They’ll have stopped lying, but they won’t earn substantial a Trust Rating for doing so.
4. Most Trusted Publications
After all that, it may seem like finding reliable consumer electronics and appliance reviews online feels impossible these days. Between fake testing claims and profit-driven motives, who can you actually trust if the biggest names are faking it?
The good news? Not every publisher cuts corners. We’ve uncovered the top trusted testers during our investigation—publications scoring about a 60% Trust Rating that actually test their products and deliver honest, reliable insights.
You might have thought it was impossible, that the 55 indicators were too strict—but four publications, RTINGs, HouseFresh, Top 10 VPN, and VPN Mentor proved otherwise during our investigation, achieving the status of Highly Trusted testers.
We investigated 163 Broad, 232 Niche, and 101 HyperNiche publications to find the best in each group. All 496 sites were evaluated against the same 55 indicators. Here’s an overview of who the true testers are we discovered.
Key Takeaways
- Publications reviewing less categories tend to be more trustworthy:
- 16.8% of Hyperniche publications (17 out of 101) earned a passing Trust Rating of over 60%. This surpasses Niche’s 10.8% success rate (25 out of 232) and Broad’s 8.6% (14 out of 163).
- Hyperniche publications have the lowest percentage of Fake Testers (21.78%) compared to Niche (42.24%) and Broad (63.41%) groups. This underscores how a narrow focus helps maintain transparency and accountability, while broader scopes struggle with consistency and credibility.
- Top 8* Trusted Broad Publications
- The Top 3: RTINGS takes the top spot with an impressive 99.58% Trust Rating, excelling in 13 categories we investigated for broad tech reviews. Your Best Digs (83.18%) and TechGear Lab (80.07%) follow closely, proving their trustworthiness across 7 and 21 categories we reviewed, respectively.
- Traffic Leaders: Tom’s Guide pulls in an incredible 20.11 million visitors a month, making it the most visited publication on this list. RTINGS (9.10 million) and Tom’s Hardware (3.79 million) also command large audiences, showing their strong influence among readers seeking reliable reviews.
- Three Exclusions: Wirecutter (80.38% Trust Rating), PCMag (66.85%), and Which? (65.70%) were excluded due to their Fake Reviewer classification. Wirecutter and PCMag were flagged in 3 categories each, while Which? had 7 categories with fake testing. *This left us with only 8 broad publications with at least a 60% Trust Rating.
- Top 10 Trusted Niche Publications
- The Top 3: HouseFresh dominates with an outstanding 95.95% Trust Rating, earning it a Highly Trusted classification for air purifier reviews. E Ride Hero (83.80%) and Sound Guys (82.40%) round out the top three, showing reliability in electric scooter and audio reviews, respectively.
- Traffic Leaders: Sound Guys leads the pack in traffic with 2.32 million visitors monthly, followed by BabyGearLab (500,186) and Motor 1 (339,700), reflecting their influence within their niches.
- One Exclusion: Outdoor Gear Lab (81.35% Trust Rating) was excluded despite its score, as half of the reviews we investigated were flagged for fake testing, disqualifying it from the trusted leaderboard.
- Top 10 Trusted Hyper-Niche (or Specialized) Publications
- The Top 3: Top 10 VPN leads with an exceptional 102.20% Trust Rating, standing out for its reliability in VPN reviews. VPN Mentor (97.45%) and Air Purifier First (88.65%) round out the top three, excelling in hyper-focused categories like VPNs and air purifiers.
- Patterns in Specialization: A significant trend emerges in VPN reviews, with 3 of the top 10 publications (Top 10 VPN, VPN Mentor, and VPN Testing) specializing in this category. Other common areas of focus include e-cooters and consumer electronics.
- No Exclusions: Unlike other focus groups, no publications were excluded from the hyperniche list. This reflects both the smaller number of categories we investigated and the rigorous specialization that these sites bring to their trusted reviews.
Next we’ll expand on each focus group’s top trusted testers plus some examples of how they prove they’re testing unlike the many fake testers we discussed earlier.
Top 8 Trusted Broad Publications
The Broad group covers 15 or more product categories, which provides more opportunities to “mess up” in testing practices, like what happened with Wirecutter, Which? and PCMag. This is likely why we only have 8 viable top contenders in this group—there’s simply more room for inconsistencies to surface.
While we discussed the top 3 earlier, some publications in the Broad group still have room for improvement. Tom’s Hardware, Tom’s Guide, and Tech Pro Journal received Mixed Trust ratings of 67.79%, 65.66%, and 63.35%, respectively. While they secured spots on the top trusted leaderboard, their reviews often fall short of the consistency and transparency readers expect across the categories we investigated. However, this makes the achievements of the leaders even more impressive.
As we’ve seen, broad publications face unique challenges, tackling 15 or more product categories while striving for consistency.
Now, we’ll turn our attention to the Top 10 Trusted Niche Publications, where specialization plays a key role in building trust.
Top 10 Trusted Niche Publications
The top 10 trusted niche publications showcase the strength of specialization, excelling across 3–15 categories with consistency and trust. This group tackled another challenge by balancing testing depth within a larger scope than hyperniche sites in order to secure a spot in the top 10.
Despite one Fake Reviewer exclusion, we still had enough niche publications to qualify for the top 10.
After leaders like HouseFresh, E Ride Hero, and Sound Guys, publications like AV Forums (82.15%) and Food Network (81.85%) highlight excellence in focused areas like AV equipment and food.
Rounding out the list, BabyGearLab (72.90%) and AnandTech (71.40%) demonstrate that niche sites can maintain trust even with technical or everyday essentials. This group proves that success comes from mastering multiple categories, balancing specialization with consistency.
With their specialized focus and commitment to transparent testing, the top 10 niche publications prove that performing testing depth across a moderate range of categories is achievable.
Next, we narrow the lens even further and explore the top 10 Trusted Hyper-Niche Publications, where mastery in 1–2 categories sets these sites apart.
Top 10 Trusted “Hyper-Niche” (or Specialized) Publications
HyperNiche publications focus on just 1–2 specific categories, making them the most specialized group we analyzed. This narrow scope allows these sites to demonstrate unmatched depth and expertise in their chosen areas, from VPNs to electric scooters to air purifiers.
With fewer categories to cover, hyperniche publications can devote their resources to thorough testing and transparency, often setting the gold standard for what trusted reviews should look like.
Take Top 10 VPN and VPN Mentor as examples. Both excel in VPN reviews, earning Trust Ratings of 102.20% and 97.45%, respectively. Their detailed performance metrics and testing transparency set them apart, proving that hyper-focus pays off. Similarly, Electric Scooter Guide and Air Purifier First specialize in highly specific categories, earning their spots by going deep where it counts.
What’s striking is how these publications demonstrate consistent excellence, even in categories where testing can be highly technical. For instance, Aniwaa brings precision to 3D printing reviews, while TFT Central dives into consumer electronics with thorough testing protocols. This attention to detail not only builds trust but also sets a benchmark for how hyperniche reviews should be done.
The top 10 hyperniche publications prove that specialization is one path to trustworthiness. When you focus on doing one thing exceptionally well, you deliver value that readers trust—and return for time and again.
Looking at our Trust Rating results across all 496 sites, a pattern emerges across the groups: a publication’s scope plays a critical role in determining its trustworthiness.
Success Rate by Scope
While we investigated less hyperniche publications versus the broad and niche groups, the hyperniche groups had a higher success rate out of any group.
Out of the 101 hyperniche publications we investigated, 17 publications surpassed the 60% Trust Rating benchmark—a success rate of 16.8%. While this may seem low, it exceeds the success rates of broader focus groups.
For comparison, only 25 out of 232 niche publications passed (10.8% success rate), and 14 out of 163 broad publications (8.6% success rate) passed.
Next we’ll explore the least trusted publications by scope and try to identify any patterns.
The Least Trusted Publications
As we know, not every publication earns readers’ trust. We’ve discussed many famous publications and parent companies that earned failing trust ratings and were found to be faking their testing. But what about who’s at the very bottom of the barrel? Who has the lowest Trust Rating of all?
If you were curious, 86 publications earned under a 10% Trust Rating (17% of the dataset). Two publications (Cool Material and Reviewnery) scored a 0%. Across the broad, niche, and hyper-niche categories, a lot of publications stand out for all the wrong reasons—unreliable testing, fake reviews, and a lack of transparency.
These trust issues aren’t confined to one type of ownership either. Both independently owned sites and those backed by large corporations contribute to the problem.
In this section, we’ll highlight the least trusted publications by scope, showcasing the Top 10 Untrustworthy Broad, Niche, and Hyper-Niche publications. These are the sites with the lowest Trust Ratings in our dataset, reflecting how poor practices can undermine even specialized expertise.
Let’s take a closer look at how these sites failed to meet the standards readers deserve.
Key Takeaways
- Top 10 Untrustworthy Broad Publications
- The Worst Performers: The bottom three publications—Cool Material (0.00%), HackerNoon (3.60%), and Reliant.co.uk (4.20%)—reflect a severe lack of trustworthiness. Cool Material stands out as the absolute worst, with no evidence of reliable testing or transparency, earning a Fake Reviewer classification.
- Independence Doesn’t Equal Always Trust: Out of the 10 untrustworthy publications, five are independently owned—HackerNoon, Reliant.co.uk, Reset Anything, Perform Wireless, and Frenz Lifestyle Hub. These results show that while independence offers the opportunity for unbiased testing, it doesn’t guarantee credibility.
- Top 11 Untrustworthy Niche Publications
- The Absolute Worst: Reviewnery (0.00%) stands out as the least trustworthy niche publication, showing no evidence of reliable testing or transparency. Similarly, LoLVVV (2.50%) and Antenna Junkies (3.25%) fail to deliver credible reviews, with both earning a Fake Reviewer classification.
- More Independent Ownership Challenges: Out of these 11 untrustworthy sites, 8 are independently owned, including Reviewnery, iOSHacker, and Fizzness Shizzness. This trend highlights that independence doesn’t inherently lead to credibility—transparency and rigorous testing remain key.
- A Tie in Untrustworthiness: Wilderness Today and Tech Junkie both earned a 6.10% Trust Rating.
- Top 10 Untrustworthy Hyper-Niche Publications
- The Worst of the Specialized: TurboFuture ranks as the least trustworthy hyper-niche publication, with a 2.50% Trust Rating and a Fake Reviewer classification.
- Independence Doesn’t Equal Reliability: 7 out of 10 of these publications are independently owned, including Best Double DIN Head Unit and The Audio Experts.
All three groups of Top 10 Untrustworthy Publications had their top 10 score less than a 7% Trust Rating. We’ll start off with the Broad group. These sites, with their wide-reaching focus and significant influence, failed to uphold the standards of transparency and rigorous testing that readers rely on.
Top 10 Untrustworthy Broad Publications
Broad publications typically cover 16 or more categories, giving them significant reach and influence over a vast array of consumer decisions. However, with such a wide scope comes the challenge of maintaining consistency and transparency across every category.
The Top 10 failed to meet this challenge, with poor testing practices, fake reviews, and a lack of evidence undermining their credibility.
These sites, spanning everything from tech to lifestyle to general news, demonstrate how a lack of rigor across multiple categories can lead to widespread mistrust. Take a closer look at how these publications fell short in upholding standards across their broad focus.
- While the Top 3, Cool Material (0.00%), HackerNoon (3.60%), and Reliant.co.uk (4.20%), hit rock bottom, the rest of the list includes big names with serious trust issues.
- The Economic Times (5.30%) and The Sacramento Bee (5.57%) are well-known news outlets, yet their reviews lack transparency. The Sacramento Bee even earned a Fake Reviewer classification, showing how even established brands can mislead readers.
- Good Morning America (6.45%) is a household name, but its product reviews fall flat. Without credible testing to back them up, trust takes a hit.
- In tech, Reset Anything (6.30%) and Perform Wireless (6.85%) claim expertise but fail to deliver. Both earned Fake Reviewer classifications for lacking testing proof.
- Even popular eCommerce and lifestyle sites like HT Shop Now (5.70%) and Frenz Lifestyle Hub (6.85%) struggle with consistency. Their broad focus exposes readers to questionable recommendations across categories.
It’s time to shift focus to niche publications—those that have a smaller focus than broad publications yet still fell short of maintaining credibility within their targeted categories.
Top 11 Untrustworthy Niche Publications (because of a tie)
Niche publications typically focus on 3 to 15 categories, making them more specialized than broad publications but less narrowly focused than hyper-niche sites. This balance offers them a unique opportunity: they can dive deeper into specific topics while still appealing to a broader audience. However, maintaining consistency across even a handful of categories can be challenging.
These publications demonstrate what happens when specialization doesn’t translate into trustworthiness. From Fake Reviewer classifications to a lack of transparency in testing, their shortcomings undermine their ability to deliver reliable recommendations.
- Reviewnery (0.00%) stands out as the least trustworthy niche site in our analysis. With no evidence of reliable testing or transparency, it fails to meet even the lowest expectations.
- LoLVVV (2.50%) and Antenna Junkies (3.25%) are also among the worst offenders. Both earned Fake Reviewer classifications, reflecting a lack of credible testing practices despite their focus on gaming and tech reviews.
- GenderLess Voice (4.00%) represents a unique niche in voice training but struggles with credibility. As a collaborative effort, its lack of consistent testing protocols leaves readers questioning its reliability.
- Removu (4.35%) and iOSHacker (5.25%) fail to deliver on their tech-focused promises. Both sites lack transparency and testing evidence, earning their places on this untrustworthy list.
- The Gadget Nerds (5.45%) and Architizer (5.75%) fall short in their respective niches of tech and architecture. While their specialized focus should enable deeper insights, their low Trust Ratings suggest otherwise.
- Fizzness Shizzness (6.05%) and Wilderness Today (6.10%) round out the list alongside Tech Junkie (6.10%). These sites highlight the ongoing challenge of maintaining credibility in niche markets, where readers expect expertise but often receive inconsistent or misleading information.
These results show that niche sites, while smaller in scope than broad publications, still face significant challenges in delivering trustworthy reviews. Specialization alone isn’t enough—without transparency and rigorous testing, even niche publications can fall flat.
The same applies to “hyper-niche” publications, which focus on an even narrower range of categories.
Top 10 Untrusted “Hyper-Niche” (or Specialized) Publications
Hyper-niche publications focus on just one or two specific categories, which should allow for detailed, high-quality reviews.
As this list of the Top 10 Untrustworthy Hyperniche Publications shows, specialization alone doesn’t guarantee trustworthiness.
- TurboFuture (2.50%) earns the dubious honor of being the least trustworthy hyperniche site, flagged as a Fake Reviewer with no evidence of credible testing.
- Other hyper-focused sites like Best Double DIN Head Unit (2.85%) and FPS Champion (3.65%) fail to deliver reliable reviews, despite their narrow scope in automotive and gaming categories, respectively.
- Interestingly, WGB (3.60%) and Best Airpurifiers (4.20%) operate in technical categories where precision is crucial, yet both fall short of providing measurable, transparent testing.
- The majority of these sites—70%—are independently owned, including Silvia Pan and The PC Wire. This high independence rate underscores that autonomy alone isn’t enough to ensure quality or trustworthiness.
- At the higher end of this untrustworthy list, Aspire360 (6.05%) and Audio Direct (6.10%) still failed to provide the consistency and transparency necessary to gain reader trust.
But we noticed a pattern that most of the Highly Trusted and Trusted publications are independent, which we explore further in the next section.
5. The Independent Testers
A significant chunk of our dataset was taken up by independent testers – publications that forged their own path without raising capital and have stayed free of the influence of large publishers and megacorps.
Unfortunately, this has not translated to excellence. Huge numbers of independent publications aren’t trusted — or worse, are fake reviews — but they do fare better than the corporate-owned publications do.
While independent publications overall suffer from a lower Trust Rating (32.11% on average compared to 33.71%), there are more independent Trusted and Highly Trusted publications.
In fact, independent publications are the only Highly Trusted publications in our dataset!
Beyond that, corporate-owned publications that earned a “Trusted” classification from us have a lower Trust Rating on average (74.56%) compared to “Trusted” independent publications (80.43%).
The power of the independent publisher means not only are they your best bet for highly trustworthy practices and information, they’re your best bet for truth.
Here are some other key takeaways about independent publications that highlight their critical role in the industry.
Key Takeaways
- You have a better chance of getting useful information from an independent publication – but not by much. 6.8% of the independent sites we researched are trustworthy or highly trustworthy, while just 4.9% of corporate sites are trustworthy (and not a single one is highly trusted.)
- The only Highly Trusted publications are independent. There are just 4 publications that managed a “Highly Trusted” classification – that’s 0.8% of our entire dataset.
- Among the aspects of trust ratings, Data Science contributes most significantly to independent publishers’ scores, followed by Visual Evidence. This suggests that independent publishers may excel in providing data-driven, evidence-based reviews.
- The wide range of trust ratings among independent publishers (0.00% to 102.20%) indicates substantial variation in trustworthiness. This variation might be explained by factors such as resources, expertise, niche focus, and individual publication practices.
- Takeaway: The chances of independent publications being fake reviewers are distressingly high. 39% of the independents in our dataset are fake reviewers, with testing claims that are not supported by testing data and custom imagery. It’s difficult to say why exactly there’s so many – but pressures created by corporate media could be the culprit by effectively creating a “race to the bottom” where costs are minimized (along with useful information and testing) in order to keep ledgers in the black.
For this analysis, independent publishers are defined as tech review publications that have not raised external capital, have not acquired other sites, are not a division of a larger conglomerate, and are not publicly traded companies. In our dataset, these publishers are marked with a “Yes” in the independent column.
This tells us two different things.
The first thing it tells us is that specialized sites are doing better than broader sites – but as we saw above, specialization doesn’t necessarily mean you’re guaranteed to do better (in fact, single category sites tend to do worse on average.)
Consider Cool Blue – they claim to test televisions, but their testing process is qualitative, without hard numbers to back up what mostly comes across as first-impressions, hands-on reviews.
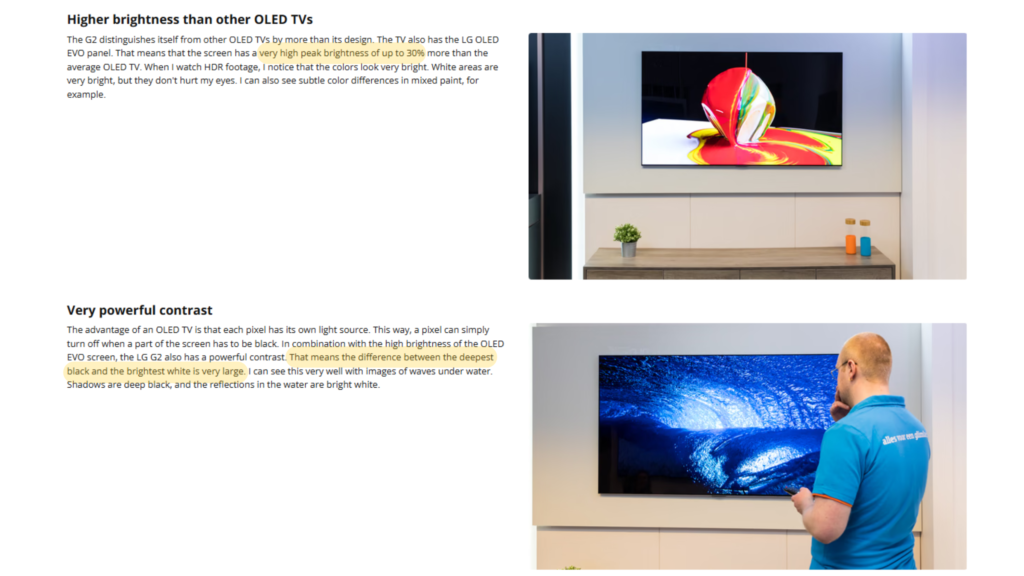
Secondly, it tells us that having a high average Trust Rating while testing multiple categories is an impressive feat, and difficult to manage, but actually possible.
Publications like RTings and TechGearLab, which cover over a dozen each, are particularly praiseworthy for successfully using rigorous testing methods across multiple product categories and providing useful testing data. Consider how RTings structured out their input lag data – it’s exhaustive.
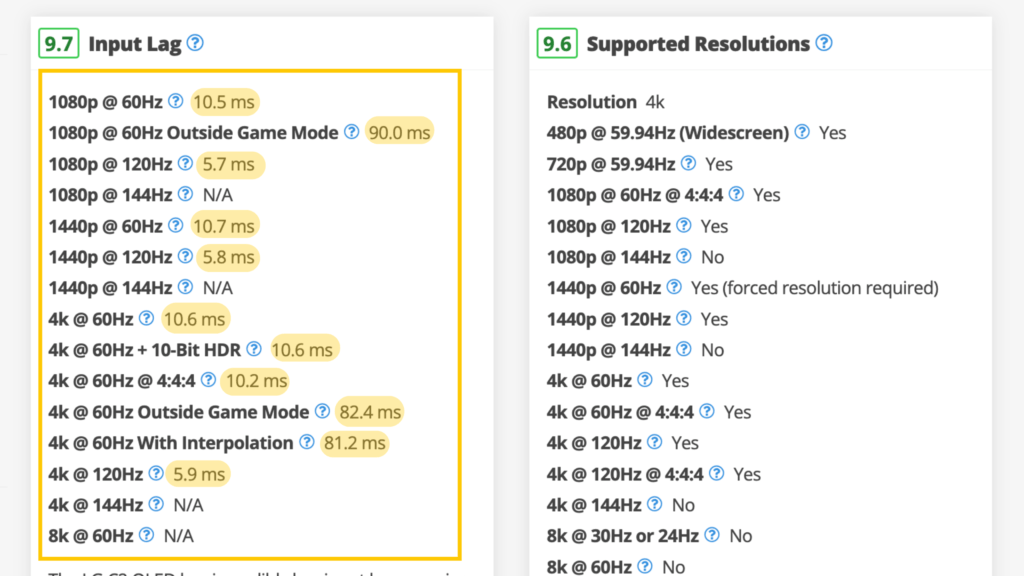
Not all independent testers do a job as good as places like RTings or TechGearLab (in fact, many do a terrible job), but the fact only independent testers produce the highest quality, most trusted data means the profit-over-people approach of so many corporate media companies is limited and short-sighted.
6. Product Categories in Focus
Trying to do research on products has become more difficult over the last several years. In addition to the ever-changing landscape of search results on the part of Google’s search empire, there has been a continuous shift (mostly a decline) in the quality of reviews being published by outlets. This isn’t to say they’re being written more poorly, but rather that many reviews now make testing claims that are either poorly supported or entirely unsupported.
We assume that the 30 categories we assessed are a good representation of the tech journalism. We recognize that there are many other categories to cover but given the time tables and cost, we felt these 30 are an accurate representation of what is occurring in the industry.
This troubling trend of declining review quality is particularly evident in specific product categories, where the stakes are higher, and the challenges of accurate testing are more pronounced.
One area where these issues hit hard is gaming gear. The mix of high costs, audience expectations, and the challenge of proper testing has made it a hotspot for untrustworthy practices.
6.1. The Downfall of Gaming Journalism
For this analysis, we focus on gaming hardware and peripherals, specifically gaming chairs, gaming headsets, and gaming mice. These products form a crucial part of the gaming experience and are frequently reviewed by tech publications. We investigated 111 individual gaming publications and 266 sets of reviews and guides across three individual categories.
Key Takeaways
- Gaming Reviews Lack Trust: A staggering 77% of gaming tech reviews are untrustworthy, highlighting the severe credibility issues in this space.
- Top Trusted Sources: Rtings and WePC stand out as reliable publications in the gaming category, earning our highest trust.
- Fake Testing Red Flags: 12% of gaming tech reviews exhibit fake testing practices. The biggest offenders? Forbes, Consumer Reports, and Digital Trends.
- Non Trusted Dominates: Nearly half (45%) of gaming reviews fall into the Non Trusted classification. This includes reviews from major names like GamesRadar, PC Gamer, and IGN Middle East.
- Trusted but Barely: Trusted gaming publications earn an average Trust Rating of 76%—just scraping the bottom half of the Trusted range (70–89%). There’s room for improvement.
How to Properly Test Gaming Gear
When reviewing gaming products, proper testing means focusing on measurable, meaningful results—not vague, unsupported claims. Our investigation is guided by our own expertise and trusted expert testing methodologies that prioritize data-driven insights and real-world performance.
For gaming headsets, the key criteria to test include audio quality, microphone clarity, and latency. Reliable testing requires tools like acoustic chambers, artificial ear simulators, and signal generators to evaluate performance. Without such tools, claims about audio precision or low latency lack credibility. Read our gaming headset testing methodology to learn more.
Using credible tools and transparent methods, gaming product reviews can achieve higher trust ratings that reflect true testing. After all, publications with gaming reviews that had category-specific testing methodology have a higher average Trust Rating as a group (62.90%) than publications without one (42.28%).
Gaming Trust Rating & Classification Analysis
Now, take a closer look at the gaming reviews dataset with this table that showcases the classifications of 111 publications across gaming headsets, chairs, and mice.
- Fake Testers: 5 publications (Consumer Reports, Forbes, Don’t Waste Your Money, NY Mag and Gear Patrol) making up only 6.17%, one of the smallest proportions across gaming categories.
- Highly Trusted: 1 publication, WePC, stood out with top-tier trustworthiness.
- Not Trusted: 36 publications, such as Mashable, Digital Trends, and Popular Mechanics, were classified as untrustworthy. That means nearly 45% of the reviews demonstrated significant trust issues.
- Trusted: 10 publications like Wirecutter, Business Insider, and Reviewed provided credible insights, making up a modest portion of reliable sources.
Gaming categories face significant trust challenges, with Not Trusted publications dominating the landscape, especially in gaming mice (50%) and gaming headsets (40.21%). Fake Testers are less prevalent compared to other categories, but the low number of Trusted and Highly Trusted publications, particularly in gaming mice, leaves readers with limited reliable sources for making informed purchasing decisions.
Here’s the statistical overview for the gaming category. These numbers highlight key trends and variations across all 266 reviews and guides in this group to better understand the trust landscape of this group and against other groups as well.
| Statistic | Value |
|---|---|
| Mean | 44.99% |
| Median | 46.85% |
| Range | 5.25% – 99.80% |
| Standard Deviation | 19.90% |
The gaming category stands out with a mean Trust Rating of 44.99%, slightly above other categories like small appliances and audio & visual.
The median of 46.85% further suggests a moderate level of trust, though the presence of “Fake Testers” keeps the average lower than it could be.
The range spans from 5.25% to 99.80%, showing that while a few exceptional publications excel, the majority struggle to meet trustworthiness benchmarks.
A standard deviation of 19.90% reflects a less volatile distribution compared to categories with broader variation, such as home office products.
Next, we shift focus to the Home Office category, where reliability is critical for products that support everyday work and productivity.
6.2. Fake Testing in Home Office Reviews
The home office segment of our analysis focuses on a few important home office products. These include computer monitors, keyboards, mice, office chairs, printers, routers and webcams. We feel these products are the cornerstone of any home office when it comes to tech, and they’re the most likely products to be reviewed by any tech publication.
- Computer monitors and keyboards have huge problems with fake reviews and fake testing. 42% of the reviewers covering computer monitors and keyboards showed evidence of faked testing.
- There is an alarming amount of untrustworthiness surrounding keyboard reviews. 92% of all of the reviewers in our dataset that covered keyboards were either faking their testing or were untrustworthy. Only a single publication earned a trust rating greater than 90%.
- Almost half of router reviewers are worth trusting to some extent. While reviewers with more mixed Trust Ratings make up more than half of these reviewers (34 of the 57) this still leaves routers as the category a consumer is most likely to find reviews and reviewers worth trusting on some level.
Here’s a closer look at how the home office categories fared in our analysis. Below is an Airtable embed showcasing all 723 sets of reviews and buying guides we investigated across these seven critical product categories. This comprehensive dataset spans 208 individual office sites, with some publications covering just one category while others had reviews on up to all seven categories.
- Fake Reviewers: 49 reviewers, comprising 41.88% of this category.
- Highly Trusted: Just 1 reviewer achieved top-tier trustworthiness.
- Not Trusted: 35 reviewers lacked credibility, further emphasizing trust issues.
- Trusted: 18 reviewers provided reliable insights, offering a small but valuable resource.
The numbers reveal that while trustworthy reviewers exist, they’re vastly outnumbered by Fake and Not Trusted reviewers, leaving categories like keyboards and computer monitors particularly problematic. Only a handful of categories, like routers and printers, show consistent trust scores, highlighting a need for better transparency across home office reviews.
We conducted another statistical analysis on this group, encompassing all seven product categories, providing insights into overall trends and averages.
| Statistic | Value |
|---|---|
| Mean | 40.56% |
| Median | 39.20% |
| Range | 2.45% – 101.40% |
| Standard Deviation | 22.44% |
Moving on from the home office, we now turn to the small appliances category.
6.3. Big Problems in Small Appliances
This product category is pretty wide as far as the types of products it can cover, but we focused on a small set that are frequently covered by tech publications. The categories include air conditioners, air purifiers, blenders, coffee makers, fans and vacuum cleaners.
- It’s difficult to trust publications for useful information about health-sensitive devices like air purifiers. Three out of every four publications covering air purifiers produce fake reviews or untrustworthy ones, either because they fake their tests or do not perform any at all. 23% of the sites we analyzed that covered air purifiers faked their testing, meaning you have a nearly 1 in 4 chance of being outright misled.
- A little over one in three vacuum reviewers have serious issues with faking testing. 36% of the reviewers analyzed exhibited clear signs of faked testing and fake reviews.
- Air conditioners are the most likely place to find trustworthy reviewers, but none of them are “Highly Trusted”. Almost 27% of the reviewers covering A/Cs are worth listening to, almost half of those are only “Mixed Trust”.
Here’s a closer look at the numbers. We analyzed 555 total appliance reviews and buying guides from 205 individual sites. Some focused on one category, while others tackled all six categories. Here’s the full breakdown of our work in small appliances.
- Fake Reviewers: This category has 45 fake reviewers, making up 35.71% of this category – the largest proportion of Fake Reviewers across small appliances.
- Highly Trusted: 7 reviewers achieved the highest trust ratings, highlighting some strong performers in this category.
- Not Trusted: 42 reviewers, showing a significant portion that lacks credibility.
- Trusted: 9 reviewers stood out with reliable and transparent practices.
The small appliance categories reveal a mixed landscape of reliability. While vacuum cleaners and air purifiers lead in dataset size, their average Trust Ratings reflect only moderate trustworthiness. Fake Reviewers dominate several categories, underscoring the ongoing challenge of finding reliable sources. Despite this, a small but consistent pool of Trusted reviewers offers some hope for readers seeking honest recommendations.
This is the statistical analysis, showcasing Trust Ratings across the small appliance group.
| Statistic | Value |
|---|---|
| Mean | 38.39% |
| Median | 35.00% |
| Range | 2.85% – 101.40% |
| Standard Deviation | 24.45% |
As we transition to the audio & video category, we’ll explore whether these trends persist or if this segment shows greater promise in delivering trustworthy reviews.
6.4. Trust Issues in Audio & Video Reviews
The audio and video category is a much more focused category that has far fewer products in it, though it also features some of the most difficult to test products across all the categories we researched. Televisions, headphones, projectors, soundbars and speakers all live in this product category, and many of these require specialized equipment to properly test.
- Problems with fake testing and fake reviewers run rampant in audio/video tech reviews. Of the tech reviewers that covered audio & video equipment, 42% of them were faking their testing.
- Fake reviews are a major problem when it comes to projector reviews. Over 66% of the tech reviewers who covered projectors showed signs of faked testing.
- You can’t trust 4 out of every 5 TV reviews. Over 82% of the tech reviewers covering televisions have serious trust issues, either because they’re untrustworthy or show clear signs of fake testing and fake reviews.
Our analysis includes 769 sets of reviews and buying guides from 332 individual publications. Each publication could cover anywhere from one to all five of these categories, offering insights into the breadth and depth of their testing practices.
Below is an embedded Airtable showcasing all the data we gathered for these five categories.
- Headphones had the largest dataset, yet only 17 reviewers (8.67%) achieved Trusted status, while 37 reviewers (18.88%) were Fake Reviewers.
- The vast majority—101 reviewers (51.53%)—fell into the Not Trusted classification, reflecting significant credibility issues in this market.
The classification data makes it clear: finding reliable reviews in the audio and visual category is an uphill battle. With Fake Reviewers dominating every product type and Trusted publications making up only a small fraction, consumers are left sifting through questionable sources to make informed decisions.
To further explore these trends, we conducted a statistical analysis of the Trust Ratings for this category.
| Statistic | Value |
|---|---|
| Mean | 34.24% |
| Median | 32.95% |
| Range | 0.00% – 101.40% |
| Standard Deviation | 21.12% |
We now come to our final category we’ll examine: the ever-evolving and unpredictable world of emerging tech.
6.5. Innovation Meets Deception: All the Fake Emerging Tech Reviews
The “Emerging Tech” category covers drones, e-scooters, 3D printers, and e-bikes. As the name of this category suggests, the products living here are “emerging” in nature. Many are new technologies that are still seeing major refinements, like 3D printers, while others are categories that are becoming more accessible and affordable to your average consumer (again, 3D printers would fall into this umbrella, but so do drones, e-bikes and e-scooters.)
These categories are also unique in that they have very diverse testing methods, many of which are still being pioneered. Drones and 3D printers, for example, are still be iterated on and see dramatic improvements with each “generation” of the product, be it in flight time and stability for drones, or resolution and complexity with 3D printers.
- Products considered “emerging” tech have the most trustworthy reviewers, but that still only comes to one in three. Almost 59% of the reviewers covering products like e-bikes and drones aren’t trustworthy or exhibit signs of fake testing. In fact, 15% of the tech reviewers in the dataset are classified as fake reviewers.
- You’re most likely to run into good reviewers and good data when reading reviews about electric bikes. 36% of the reviewers in our dataset were at least “Mixed Trust” or higher.
Now that we’ve introduced the unique challenges and opportunities within the Emerging Tech category, let’s take a closer look at the data behind the reviews. Our analysis spans 359 sets of reviews and buying guides from 169 individual publications. Each publication may cover one to four of the categories within this product group.
Below is an embedded Airtable showcasing all our findings across these four categories.
- Nineteen reviewers, or 19%, were classified as Fake Reviewers. This is the largest proportion of Fake Reviewers across all emerging tech categories.
- Forty-four reviewers, or 44%, were Not Trusted, showing a significant trust issue within this category.
- Trusted reviewers made up 15% of the dataset, with only one Highly Trusted reviewer demonstrating credible and thorough testing practices.
With the emerging tech categories revealing distinct trust challenges and varying proportions of credible reviewers, it’s crucial to assess the overall trust landscape statistically.
| Statistic | Value |
|---|---|
| Mean | 43.15% |
| Median | 42.60% |
| Range | 4.10% – 98.35% |
| Standard Deviation | 23.88% |
The statistics highlight notable challenges in trustworthiness. With a mean Trust Rating of 34.24% and a median of 32.95%, the group aligns closely with audio & visual categories, reflecting similar struggles with inconsistency and unreliable reviewers. A range spanning from 0.00% to 101.40% emphasizes the stark contrast between the least and most trustworthy reviewers, while a standard deviation of 21.12% reveals significant variability within the group.
The emerging tech category faces unique challenges due to the novelty and rapid evolution of its products. This creates gaps in standardized testing methods and increases the likelihood of untrustworthy reviews.
While electric bikes and e-scooters show promise with higher proportions of Trusted reviewers, the overall reliability of this group lags behind others, underscoring the difficulty of maintaining trust in newer product spaces.
7. Why Does All Of This Matter?
Because fake reviews aren’t just a nuisance—they’re actively harming readers.
It means sifting through countless reviews with no way to verify what’s real. They’re left questioning whether a product was actually tested or if the review is just another marketing ploy. Trusting a brand’s reputation alone isn’t enough when it comes to big purchases.
For corporate publishers, this is a wake-up call. They’ve turned the tech review industry into a race to the top. Instead of prioritizing rigorous testing, they’ve focused on making flashy, dishonest content and more revenue.
But readers deserve better. They rely on these reviews to make informed decisions, and right now, the system is failing them and wasting their money.
For Google, the implications are massive. With 8.5 billion daily searches, Google has unparalleled influence over what people see. Yet, our findings show they’re delivering fake reviews straight to the top of search results. This undermines trust in their algorithms—and the internet itself.
The solution isn’t complicated. Honest, transparent, and thorough testing needs to be the standard, not the exception. That’s where independent publishers can shine. They’ve proven it’s possible to be trustworthy, even in a crowded and competitive field.
Or if the testing isn’t possible, we ask that publications call their reviews “researched” or “hands-on” reviews — not “tested” reviews. In fact, we did the same to our own reviews over a year ago.
We’re here to hold tech journalism accountable. We want to call in the “Not Trusted” and “Fake Testers” and push for real change. We aim to restore trust in an industry that millions depend on everyday. Because accurate and honest reviews aren’t a luxury—they’re essential.
It’s time to fix tech journalism. For the readers, for the brands, and for the future.


