
Out with the old in with the new: It’s time to buy a new bigger, better soundbar, speaker, projector or TV for your favorite entertainment room. Then come the questions: Which size? Which model?
It’s Google time: Now you enter those keywords, “Best 65 inch TV,” then boom! Here comes a list of lengthy reviews from the world’s biggest search engine.
You scour the list, looking for the best product reviews. And then for a split second you question: How accurate are these reviews? Are they even legit? We’re here to tell you your Spidey-sense was on to something.
Despite measures to combat fake reviews and AI generated content, our two year and ongoing investigation has discovered a thriving industry of fake reviews targeting Google in tech journalism.
The world’s biggest search engine is serving up untrustorthy reviews, published by large media conglomerates like CNN, Forbes, WIRED and Rolling Stone, and traditional tech reviewers like Consumer Reports, TechRadar and The Verge. We dive into who owns which site, who can be trusted, and how to combat the rising tide of information.

KEY FINDINGS_
- Our two year investigation of trust in tech journalism reveals a thriving for-profit fake review industry dominating Google, with 75% of tech journalists labeled as untrustworthy, and a shocking 34.80% producing fraudulent, fake reviews online.
- FAKE FIVE: Our report includes the Fake Five tech journalists with the most web traffic faking their reviews. FORBES is the most egregious Fake Reviewer with a monthly traffic of 94.6M visitors and Trust Rating of 40.09%. The Guardian and Good Housekeeping rank 2nd and 3rd with over 56M visitors/month and Trust Ratings below 40% each. Rounding out our Fake Five are The Spruce and Business Insider with 40M visitors /month dominate yet score 45.10% and 44%
- The Drive and AksMen ranks lowest among Fake Reviewers with a 16.37% and 16.68% Trust Rating across several categories, followed by AskMen, Life Savvy and The Gadget Flow.
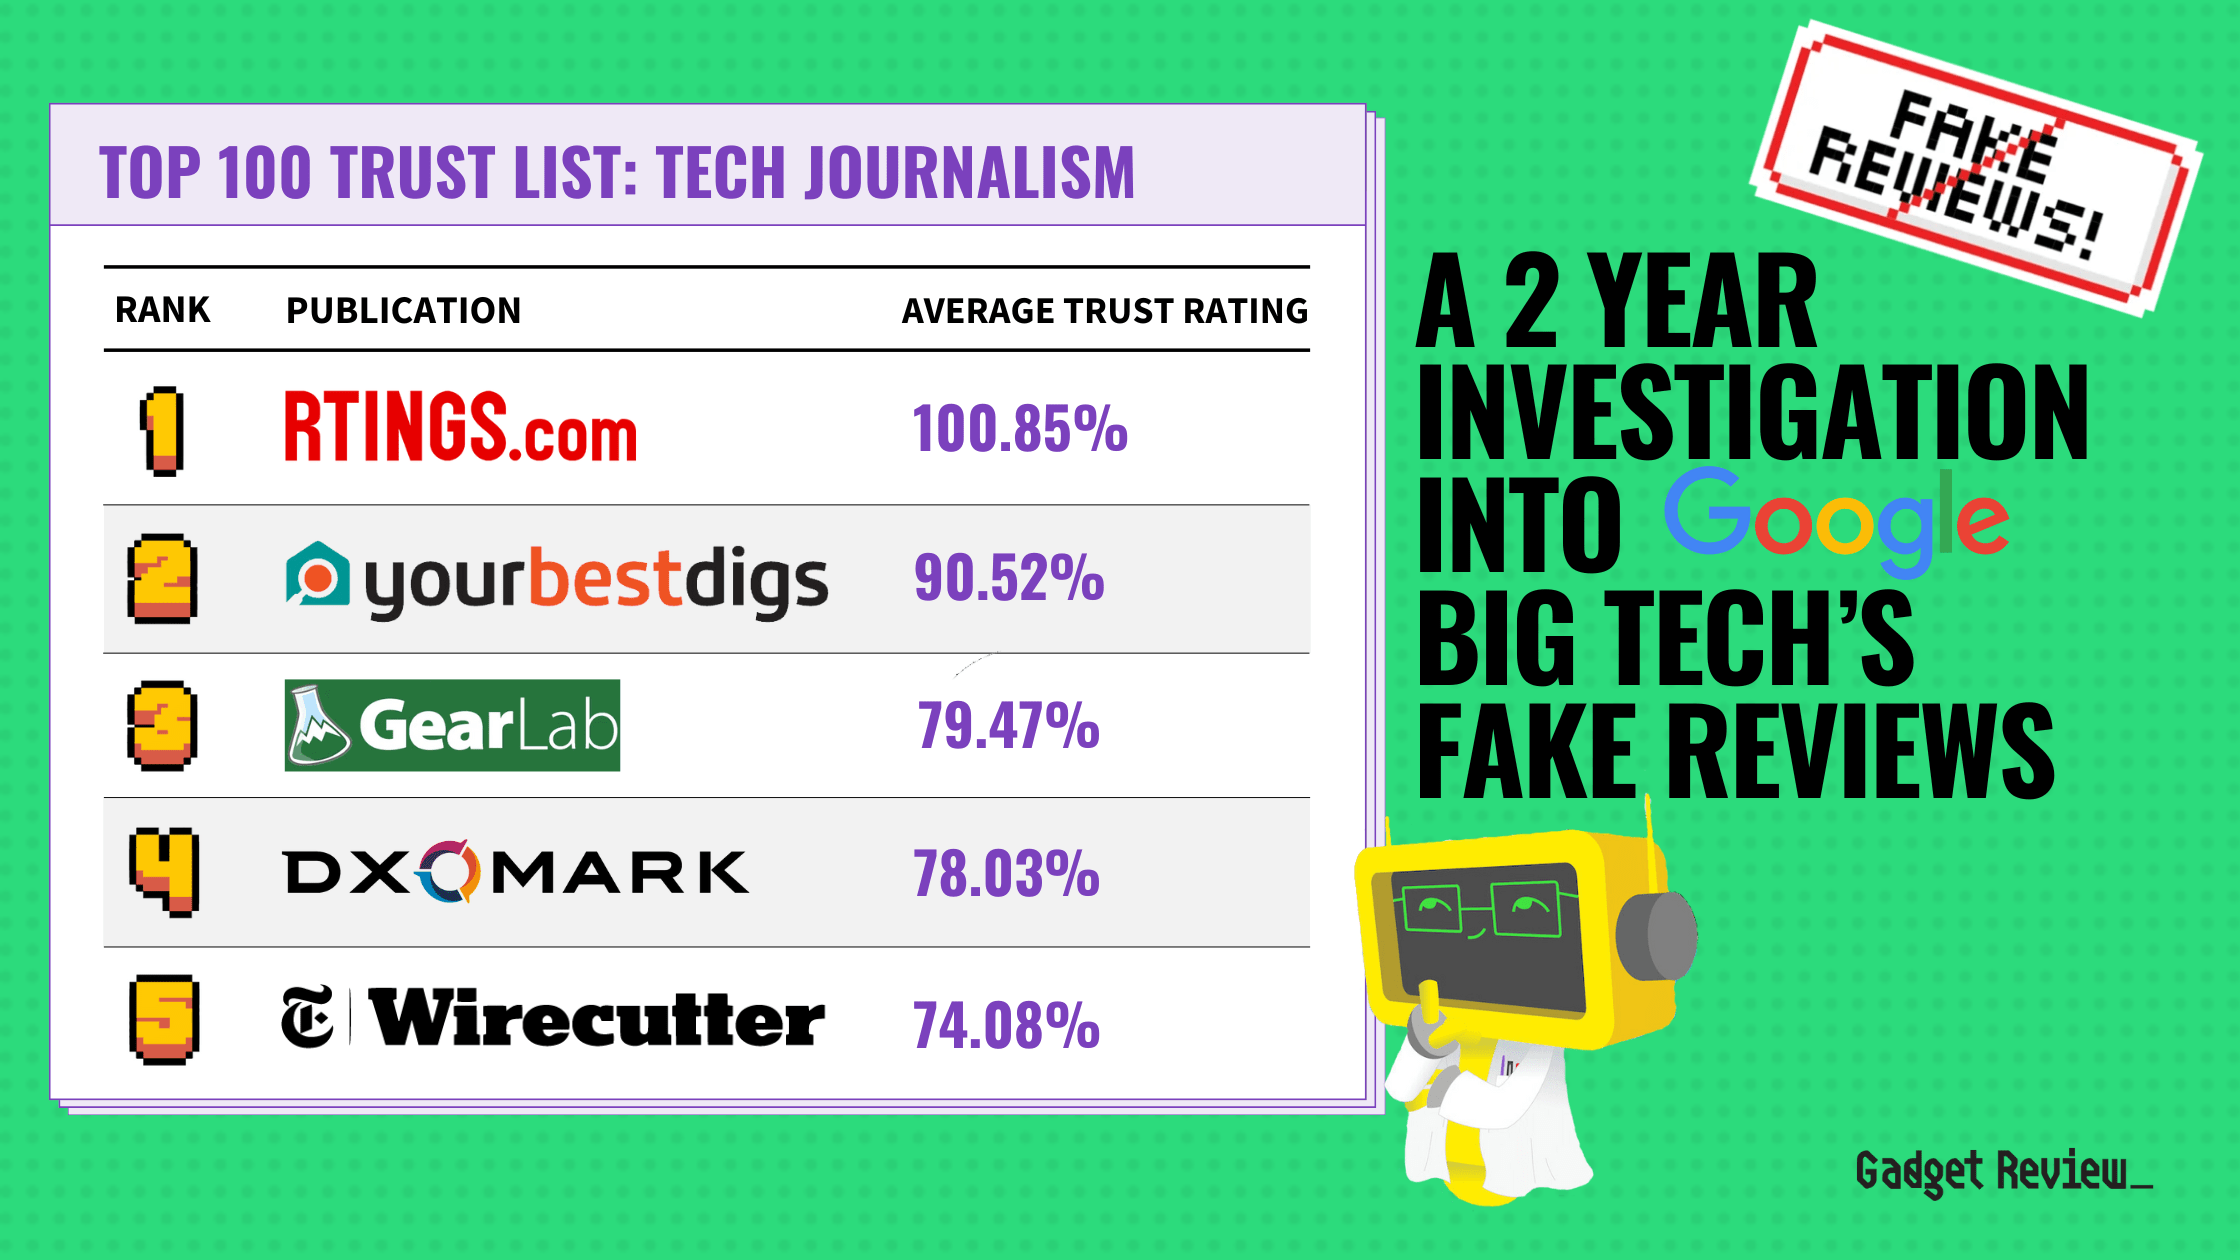
- FAB FIVE: This year, our Tech Trust List ranks Rtings.com as the highest trusted in the Americas, with a score of 101.1%. YourBestDigs.com is second at 84.82% and TechGearLab is third with 81.59%. The NYTimes Wirecutter finishes fourth with a score of 77.01%, while SoundGuys.com and PCMAG both score a 70% Trust Rating.
- Our report finds that the top 3 most trusted reviewers are independent journalists, while the Top 10 most trusted tech journalists are split evenly between independents and Big Media.
WHY THE GAME?
Why do sites claim to test a product, but in fact have not tested at all? Simply put, it’s all about the dollar bill and the clicks and purchases made off of product reviews. The more you test, the more people trust you and buy from you, so the profit growth is accomplished for a corporation. You know, that ever-ending desire for constant growth of money that we’re all a part of.
Publishers are pumping out positive reviews in order to capitalize on the consumer searching for product reviews, $150 million e-commerce sales are driven by affiliate marketers according to most estimates (SOURCE).
$150 million e-commerce sales are driven by affiliate marketers.
There are over 377 million monthly searches that are related to transactional product reviews. That includes 52 million unique keywords that online shoppers are searching for. This is a thriving industry of fake reviews that’s targeting the Google platform to thrive off its back.
HOW DO WE FIX THIS PROBLEM?
- Be aware that when you go search product reviews this issue of fake reviews exists.
- Educate yourself by reading our annual “Trust List” of the most trusted testers in consumer tech.
- Use our “True Rating” for every product which offers a reliable rating. The True Score”is derived from our “Trust Ratings” so all fake reviews are filtered out.
TOP 10 FAKE REVIEWERS IN TECH JOURNALISM
The following reviewers earned a failing average Trust Rating under 60% and claim to test in at least three of their categories. To make this list, they must also have reviews in at least five categories, and they’re sorted by who earns the most monthly traffic.
| RANK | REVIEWER | TRUST RATING | # CATEGORIES | MONTHLY TRAFFIC | TEST CLAIM |
|---|---|---|---|---|---|
| 40.09% | 13 | 94,618,039 | Example | ||
 |  | 39.06% | 6 | 57,686,748 | Example |
 |  | 38.14% | 9 | 54,839,524 | Example |
 | 45.10% | 5 | 31,882,371 | Example | |
 | 54.26% | 13 | 29,695,237 | Example | |
 | 44.80% | 11 | 27,493,093 | Example | |
 | 52.71% | 13 | 14,906,047 | Example | |
| 54.76% | 13 | 14,319,661 | Example | ||
 | 54.11% | 13 | 13,403,703 | Example | |
 | 21.87% | 12 | 11,556,235 | Example |
TOP 10 MOST TRUSTED IN TECH JOURNALISM
Meet the tech industry’s most trusted reviewers. Each has earned an average Trust Rating of 60% or higher across all their categories.
They must publish reviews across at least five categories. This way, we keep comparisons fair between reviewers who score well yet publish only one category versus reviewers who publish multiple categories.
Curious about their specialties? We’ve also listed their top three categories for you.
| Rank | Reviewer | Avg Trust Rating | # of Categories | Best For | Best For | Best For |
|---|---|---|---|---|---|---|
| 101.11% | 16 |  |  |  | ||
|  | 84.82% | 7 |  |  |  |
| 81.59% | 23 |  |  | | |
| 77.01% | 27 | | | | ||
| 70.27% | 5 |  | |  | ||
| 70.88% | 12 | |  |  | ||
 | 68.26% | 14 | |  |  | |
 | 67.82% | 12 | | | | |
| 66.78% | 28 | |  | | ||
| 66.45% | 12 | | |  |
WHAT IS A “TRUST RATING”?
We gathered test data on almost 1,000 products in over a dozen categories including TVs, and now we’re testing the testers. We’ve been researching how trustworthy TV reviewers are since 2021, calculating Trust Ratings for 530 reviewers in total.
Gadget Review performed a rigorous evidence-based, data-driven scientific analysis of 526 tech journalists across 30 categories (electronics and appliances) using 55 indicators of trust, expertise, transparency, data science and credibility. The Trust Rating is the resulting score from 0 to 100 for each publication classifying them into four categories: Highly Trusted, Trusted, Untrusted and Fake Reviewers. The Trust Ratings power our True Score for tech products, effectively filtering out all fake reviews from our quality score to make it the most reliable on the web.
We developed our proprietary Trust Rating system to classify trustworthy, untrustworthy, and fake TV reviewers. Calculating a Trust Rating is a hands-on approach since we have real people research each publication and fill out 67 indicators to gauge how they practice transparency and thorough, proven product testing.
You can learn more about how we test the testers and some of the indicators we use.
The final Trust Rating of a site is a weighted calculation. If a site reviews multiple categories, they’ll receive a Trust Rating for each category:
- 20% of the Trust Rating is the General Score. It’s based on how transparent the site is in general along with how in-depth their scoring system is. It’s scored only once.
- The other 80% is the Category Score. This is determined by how in-depth the testing is on their reviews. Each category receives their own custom questions looking for important Test Criteria applicable to the category, such as brightness for TVs. We explain our process to determine important TV Test Criteria in our TV Testing Methodology.
CLASSIFICATIONS OF TRUST RATING
During our TRUST RATING evaluation, we determined who tests the best, those who claim to test but don’t, and the sites who don’t claim to test but still have failing Trust Scores.
When our investigation concluded, we created 3 levels of Trust which make up our “Trust List” followed by smaller tiers that exist in certain levels.
- HIGHLY TRUSTED → 90-100+
- These sites passed our Trust Score evaluation by earning a score over 90%. The “cream of the crop” of publishers so to speak. Strong testing methods, plenty of photos, charts and graphs, and all the numbers you could ever ask for. We refer to these as “Industry Leaders”.
- Examples are Rtings, PCMag, CNet and Sound and Vision.
- TRUSTED → 60-89
- These publications have passed, will provide you with enough quantitative testing and useful data to be able to make a purchase decision, though they might feature more qualitative analysis and discussion than the top dogs do.
- Reliable Tier 70-89; Solid info you can always rely on.
- Passable Tier 60-69; Not as good, but still usable.
- These publications have passed, will provide you with enough quantitative testing and useful data to be able to make a purchase decision, though they might feature more qualitative analysis and discussion than the top dogs do.
- NOT TRUSTED → 0-59
- These testers are failing. It could be from a lack of support and proof for their testing, from being fraudulent in their claims about testing, or from simply not offering up enough useful information. These publications aren’t worth considering when you make a purchase decision.
- Struggling Tier – 50-59; Might be on the come-up but they’re still failing.
- Not Worth it Tier – 30 – 49; Your time is better spent elsewhere.
- Totally Unhelpful Tier – 11 – 29; Not useful, could misguide you.
- Not Even Once Tier – 0 – 10; Don’t even bother.
- These testers are failing. It could be from a lack of support and proof for their testing, from being fraudulent in their claims about testing, or from simply not offering up enough useful information. These publications aren’t worth considering when you make a purchase decision.
KEYWORDS USED FOR THE DATASET OF REVIEWERS
Before analyzing our search engine results page (SERP for short) findings, we needed to tackle scraping the right keywords within each of the 15 categories. We collected various types of transactional keywords, and each keyword had significant search volume. This verifies that large amounts of people are organically searching these keywords every day. That way, we can make sure our research findings are as relevant as possible.
Here are the types of keywords we selected:
- High-Volume, Best-Of Keywords
- Relevant terms focused on Use/Type/Brand
- At least 10 keywords that make up minimum 50,000 total search volume total
- Examples:
- “best headphones for working out”, “best printer for home”, “best vacuum for hardwood floors”
- Lower-Volume, Long-Tail Keywords
- Focused on a specific use case or brand
- Only one keyword with a lower search volume ranging from 100-300
- Allows us to bring in smaller publications into our research pool for more well-roundedness
- Examples:
- “best headphones for snowboarding”, “best blender to puree food”, “best drone for roof inspections”
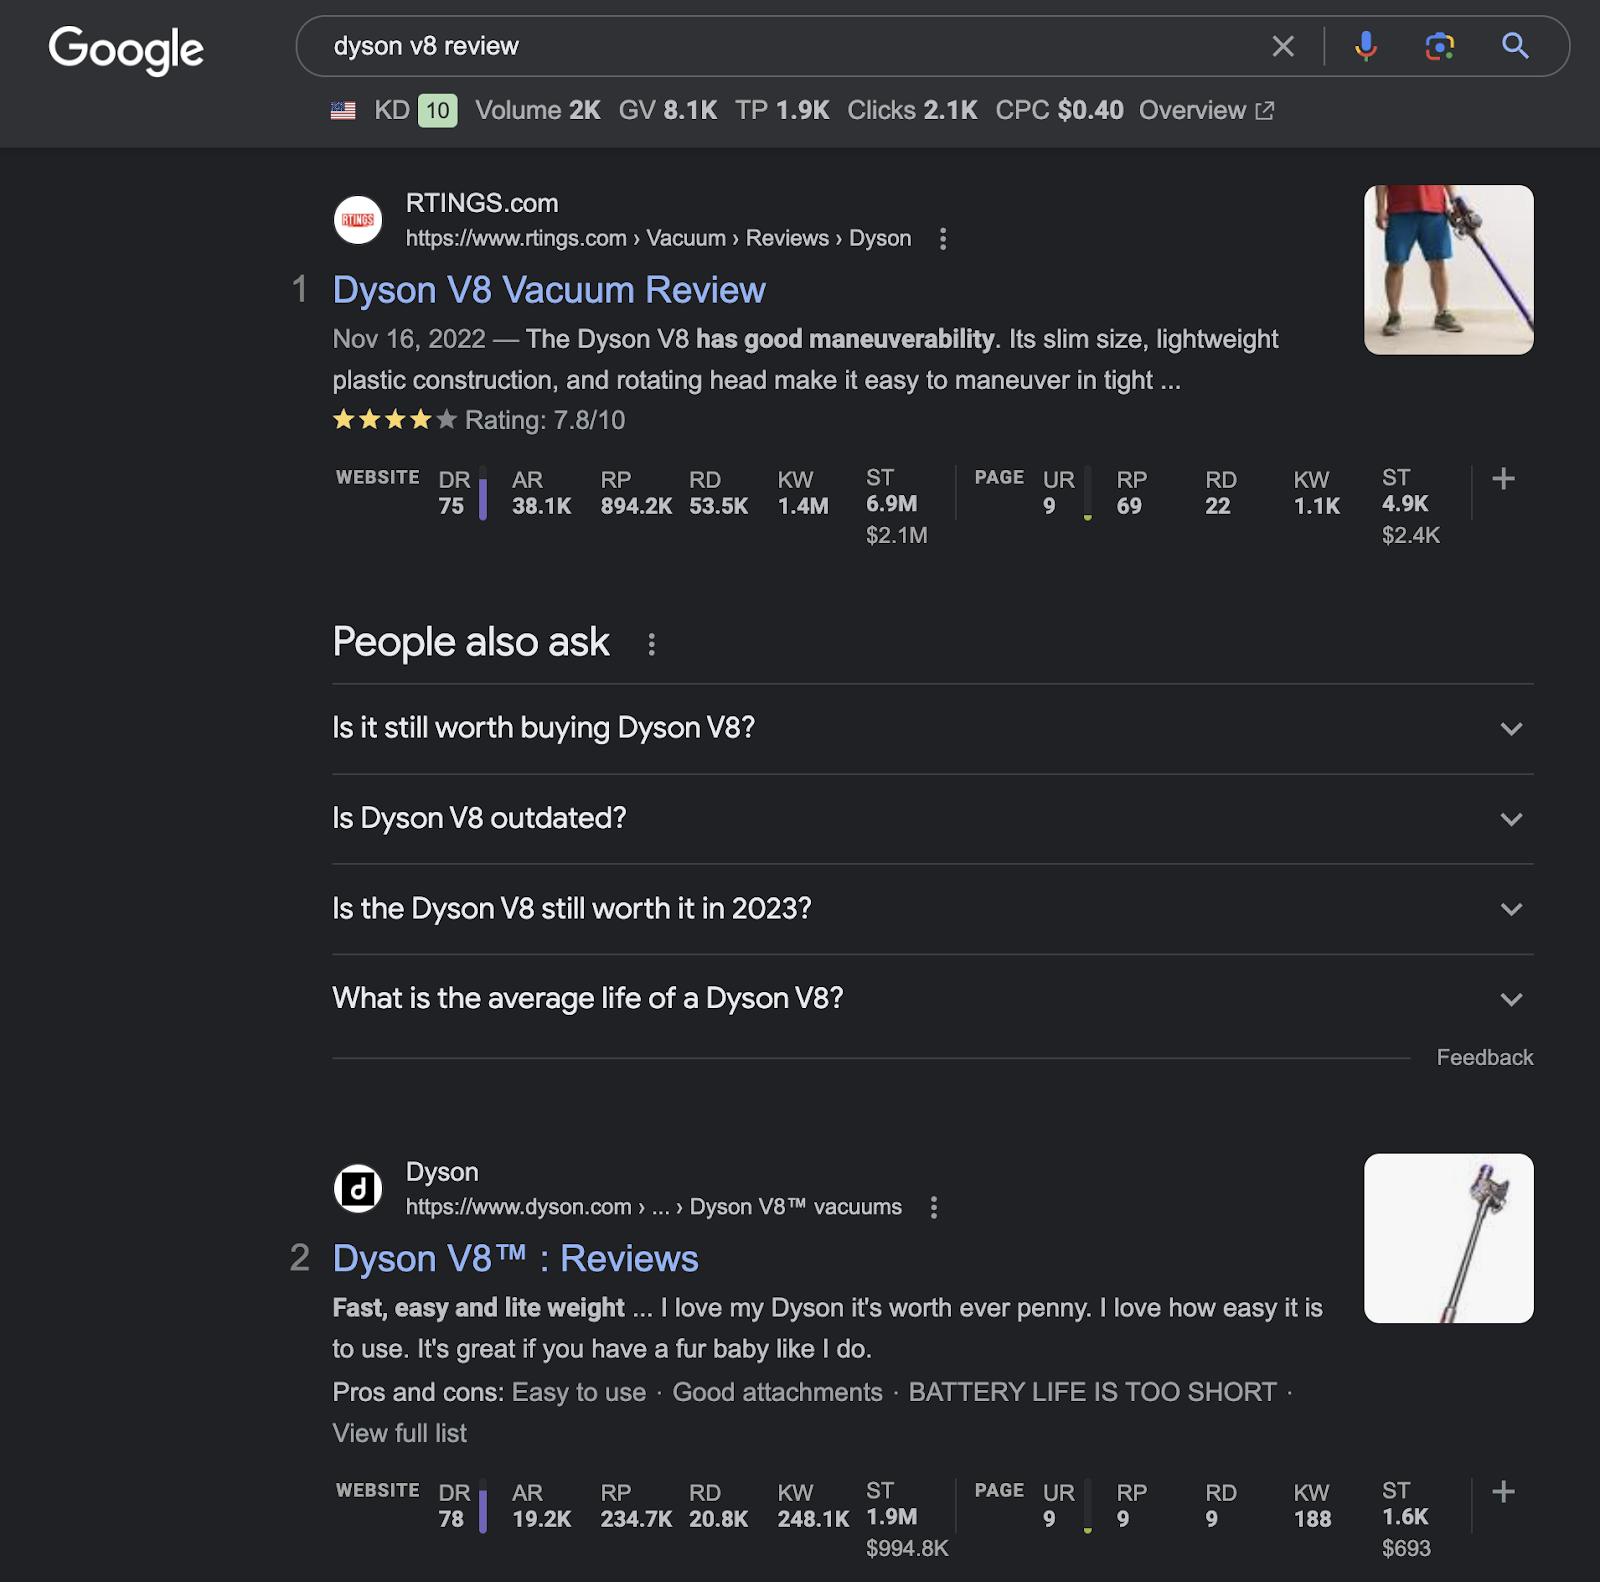
- Product Review Keywords
- The best sellers within the category
- At least three keywords
- Examples:
- “dyson v8 review”, “dell xps 15 review”, “herman miller aeron chair review”
- Superlative Keywords
- “Best” isn’t the only relevant modifier people use when searching for optimal products. Depending on the category, certain modifiers can be searched to assess products with a specific quality.
- 1-3 keywords with decent volume
- Examples:
- “brightest tv”, “fastest electric scooter”, “most comfortable office chair”


Those still curious about keyword selection and our SERP scraping process can dive into the details here.
Fake Reviews In Google Search Results_
Below is an example of a popular yet problematic page 1 of Google for the keyword “best tv for bright room” which earns 1,600 searches a month. There are six unique expert publications (RTINGs appears twice at the top and bottom) and three forums:
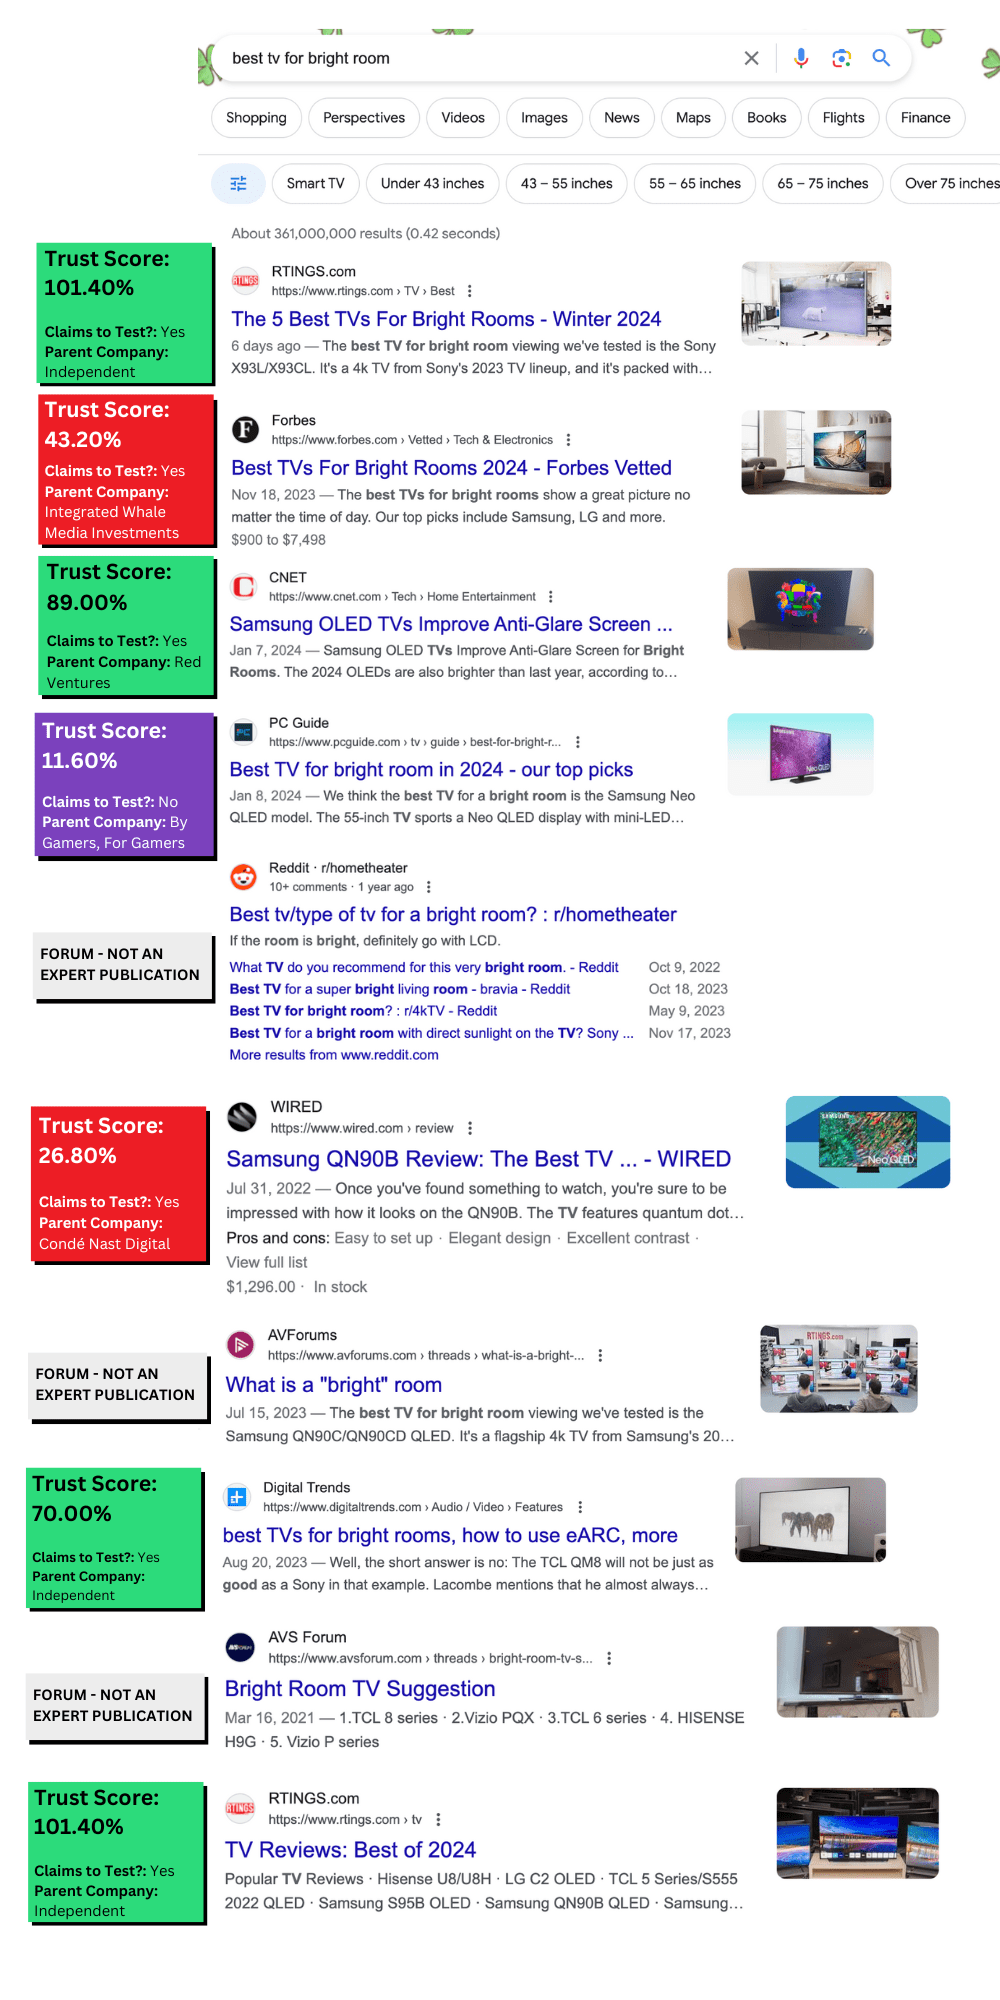
Out of the six publications:
- 3 are Trusted Reviewers (reviewers who say they test and have at least a 60% Trust Rating)
- RTINGs, CNET and Digital Trends
- 2 are Fake Reviewers (reviewers who say they test but have under a 60% Trust Rating)
- Forbes and Wired
- 1 is an Untrustworthy Reviewer (reviewers who don’t claim to test but they earned under a 60% Trust Rating)
- PC Guide
- 2 are independent, and the other 4 belong to a parent company.
- Independent: RTINGs and Digital Trends
- Owned by a Parent Company: Forbes, CNET, Wired, and PC Guide
So you have a 50% chance of reading a fake or untrustworthy review amongst these search results. Here’s a table of the page 1 results:
| POSITION | SITE | TYPE OF SITE | TRUST SCORE | CLAIMS TO TEST? |
|---|---|---|---|---|
| 1 | RTINGs | Publication | 101.40% | Yes |
| 2 | Forbes | Publication | 43.20% | Yes |
| 3 | CNET | Publication | 89.00% | Yes |
| 4 | PC Guide | Publication | 11.60% | No |
| 5 | Forum | N/A | N/A | |
| 6 | Wired | Publication | 26.80% | Yes |
| 7 | AVForums | Forum | N/A | N/A |
| 8 | Digital Trends | Publication | 70.00% | Yes |
| 9 | AVS Forum | Forum | N/A | N/A |
| 10 | RTINGs | Publication | 101.40% | Yes |
Forbes, WIRED, Rolling Stone, and other Big Media publications have transformed into content factories, pumping out misleading, low-effort buying guides with affiliate links at a rapid pace. This is suspicious behavior because every true TV tester knows that buying guides take a long time to produce. A guide needs thoughtful, thorough testing and research performed for each TV model.
Forbes’ Fake TV for Bright Rooms Buying Guide
Trust Rating: 43.20% | Position on SERP: 2 | Buying Guide
Forbes’ TVs for Bright Rooms guide is filled with stock images and makes no sense to be placed higher than CNET and Digital Trends who actually tested their TVs.
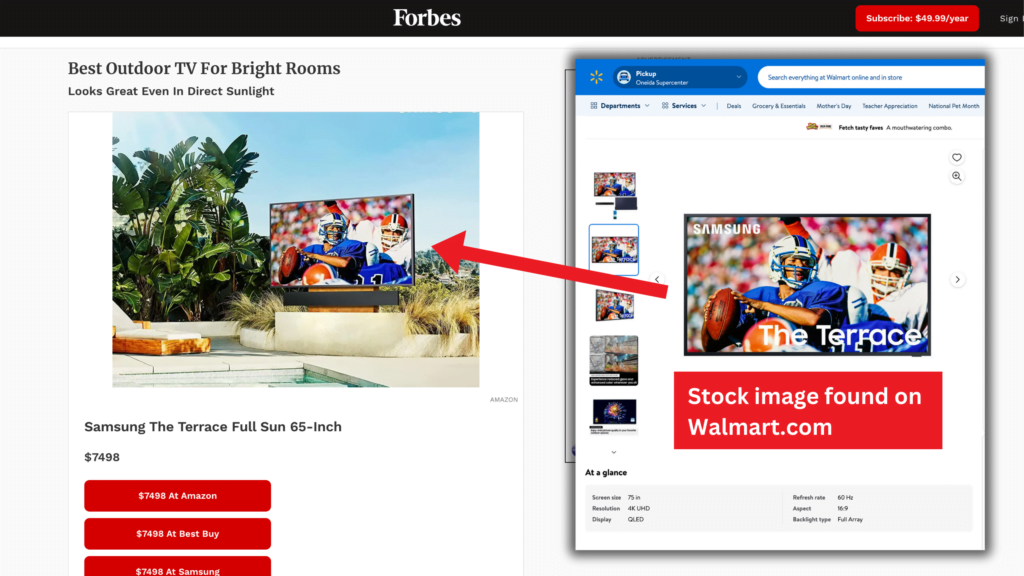
It gets more sketchy when Forbes claims to have performed “hands-on” testing, but you can’t find any quantitative measurements of the performance criteria that determine the true performance of the TV, such as brightness, response time, and color gamut.
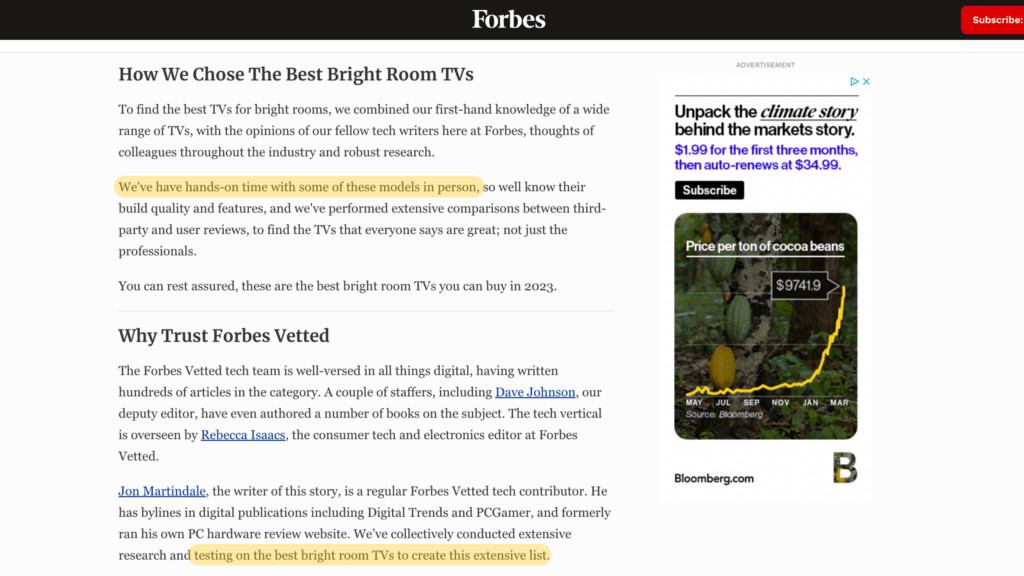
For Forbes, this means they didn’t actually test the TV. It’s just a page of flowery text describing the TV specifications provided by the manufacturer.
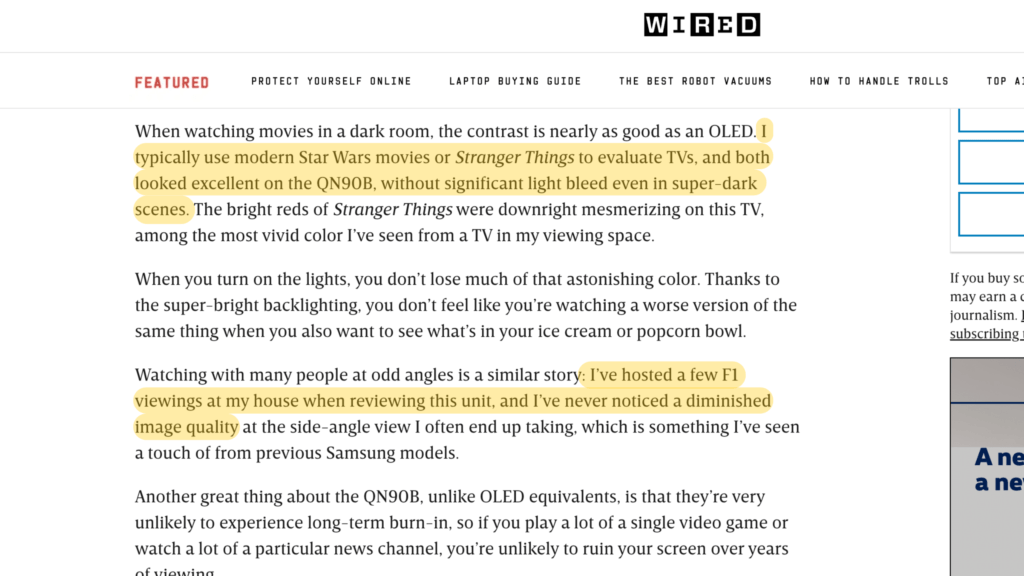
WIRED’s Fake Review of the Samsung QN90B
Trust Rating: 26.80% | Position on SERP: 6 | Product Review
The other fake review on the page 1 search results is WIRED’s review on the Samsung QN90B. The author doesn’t explicitly say “tested” in the review (you can find “tested” mentions on their other TV reviews and guides), but WIRED isn’t off the hook yet since they insinuate it in the review. The author talks in the past tense and in first-person to recall his experience using the TV. He also says “evaluate” while claiming to have reviewed the TV’s color accuracy and light bleed by playing Stranger Things and Star Wars on it.
However, there’s no visual proof or quantitative test results to back up his positive evaluations of the picture quality.
WIRED strangely puts more effort into adding colored backgrounds to stock images of the Samsung than publishing real photos of the TV, which would be way more helpful.
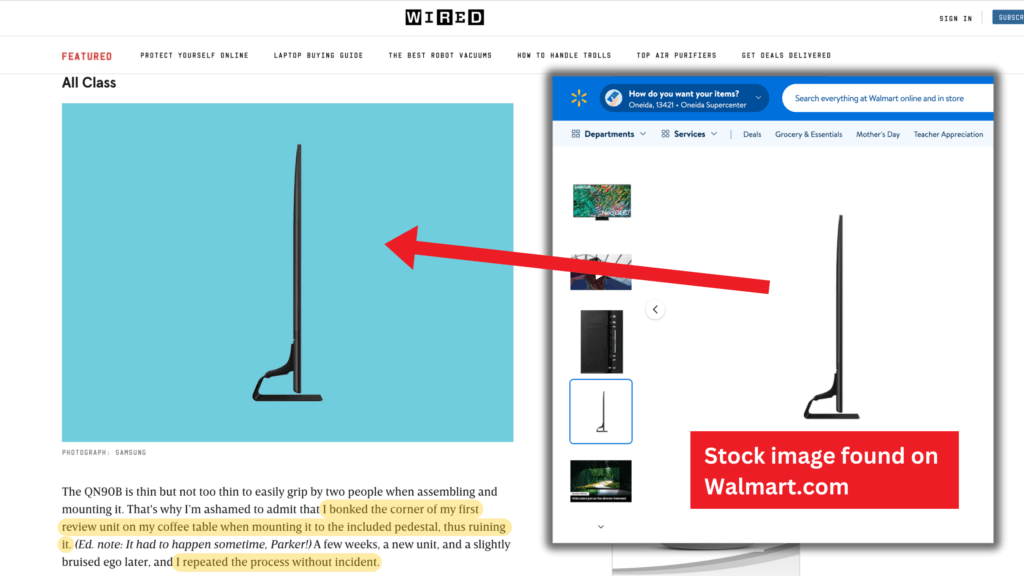
We can assume that the author spent days with this TV since he claims to have “hosted a few F1 viewing at his house when reviewing the unit”, so where are those real photos?
How Detailed.com and HouseFresh Have Also Exposed Flaws in TV Review Rankings
Our investigation, Detailed.com founder Glen Allsopp’s study, and HouseFresh founder Danny Ashton and Editor Gisele Navarro’s assessment validate the importance of the problem of Big Media outranking many independent publishers with low-effort reviews.
Our research quantitatively determined how few trustworthy TV reviewers there are and how Google presents fake reviews in 30% of its search results.
The Detailed.com study found that only 4 out of the top 100 sites for affiliate SERPs are independent. HouseFresh’s “David vs. Digital Goliaths” article also validates how Google’s algorithm has changed and ranks big media publishers high despite them producing fake reviews.
KEY STATISTIC_
Almost ⅓ of search results on page 1 of Google are fake TV reviews—the publications who say they test but have a Trust Rating below 60%.
Gadget Review, TV Trust List 2024
As for the other categories that Gadget Review has researched, we’ve found more concerning statistics:
- For soundbars, 10 of the 122 publications analyzed actually perform tests on their soundbars. That means only 8% of publications test soundbars.
- For robot vacuums, 15 of the 78 (so 19%) publications actually test the robot vacuums they review.
- For computer monitors, 33 of the 116 publications we analyzed actually test their monitors, meaning only 28% of publications test.
WHICH TECH CATEGORIES ARE MOST TRUSTED?
These are the 13 categories we’ve investigated which are ordered by the highest percentage of fake reviewers. Be careful when using Google alone to shop online, since each category is filled with fakery.
Here’s the good news though: we’ve done the legwork for you. Our Trust Lists which we’ve linked in the table identify who are the reviewers you can and can’t trust for reliable product reviews.
| Rank | Category | # of Publishers | % of Untrusted * | % of Fake Reviewers † | Trust List | |
|---|---|---|---|---|---|---|
| TVs | 206 | 87.86% | 47.57% | TV Trust List | |
| | Soundbars | 122 | 91.80% | 45.90% | Coming Soon |
|  | Office Chairs | 97 | 90.72% | 44.33% | Coming Soon |
 | Speakers | 176 | 91.48% | 43.75% | Coming Soon | |
| Computer Monitors | 115 | 71.30% | 37.39% | Coming Soon | |
| Vacuum Cleaners | 130 | 79.23% | 36.92% | Coming Soon | |
 | Projectors | 119 | 86.55% | 34.45% | Coming Soon | |
| Gaming Headsets | 115 | 72.17% | 33.04% | Coming Soon | |
 | Printers | 78 | 70.51% | 32.05% | Coming Soon | |
| Air Conditioners | 66 | 77.27% | 28.79% | Coming Soon | |
| Routers | 127 | 63.78% | 25.98% | Coming Soon | |
| Gaming Chairs | 92 | 76.09% | 22.83% | Coming Soon | |
 | Cell Phone Insurance | Coming Soon | Coming Soon | Coming Soon | Coming Soon | |
| Average | 79.90% | 36.08% |
Footnotes:
* Untrusted Reviewers: < 60% Trust Rating
† Fake Reviewers: Claim To Test + < 60% Trust Rating