
Key Takeaways_
- The Problem with Qualitative Only Reviews
- We explain what it means to perform quantitative research
- We break down who’s doing it correctly and who isn’t
Category Analysis_
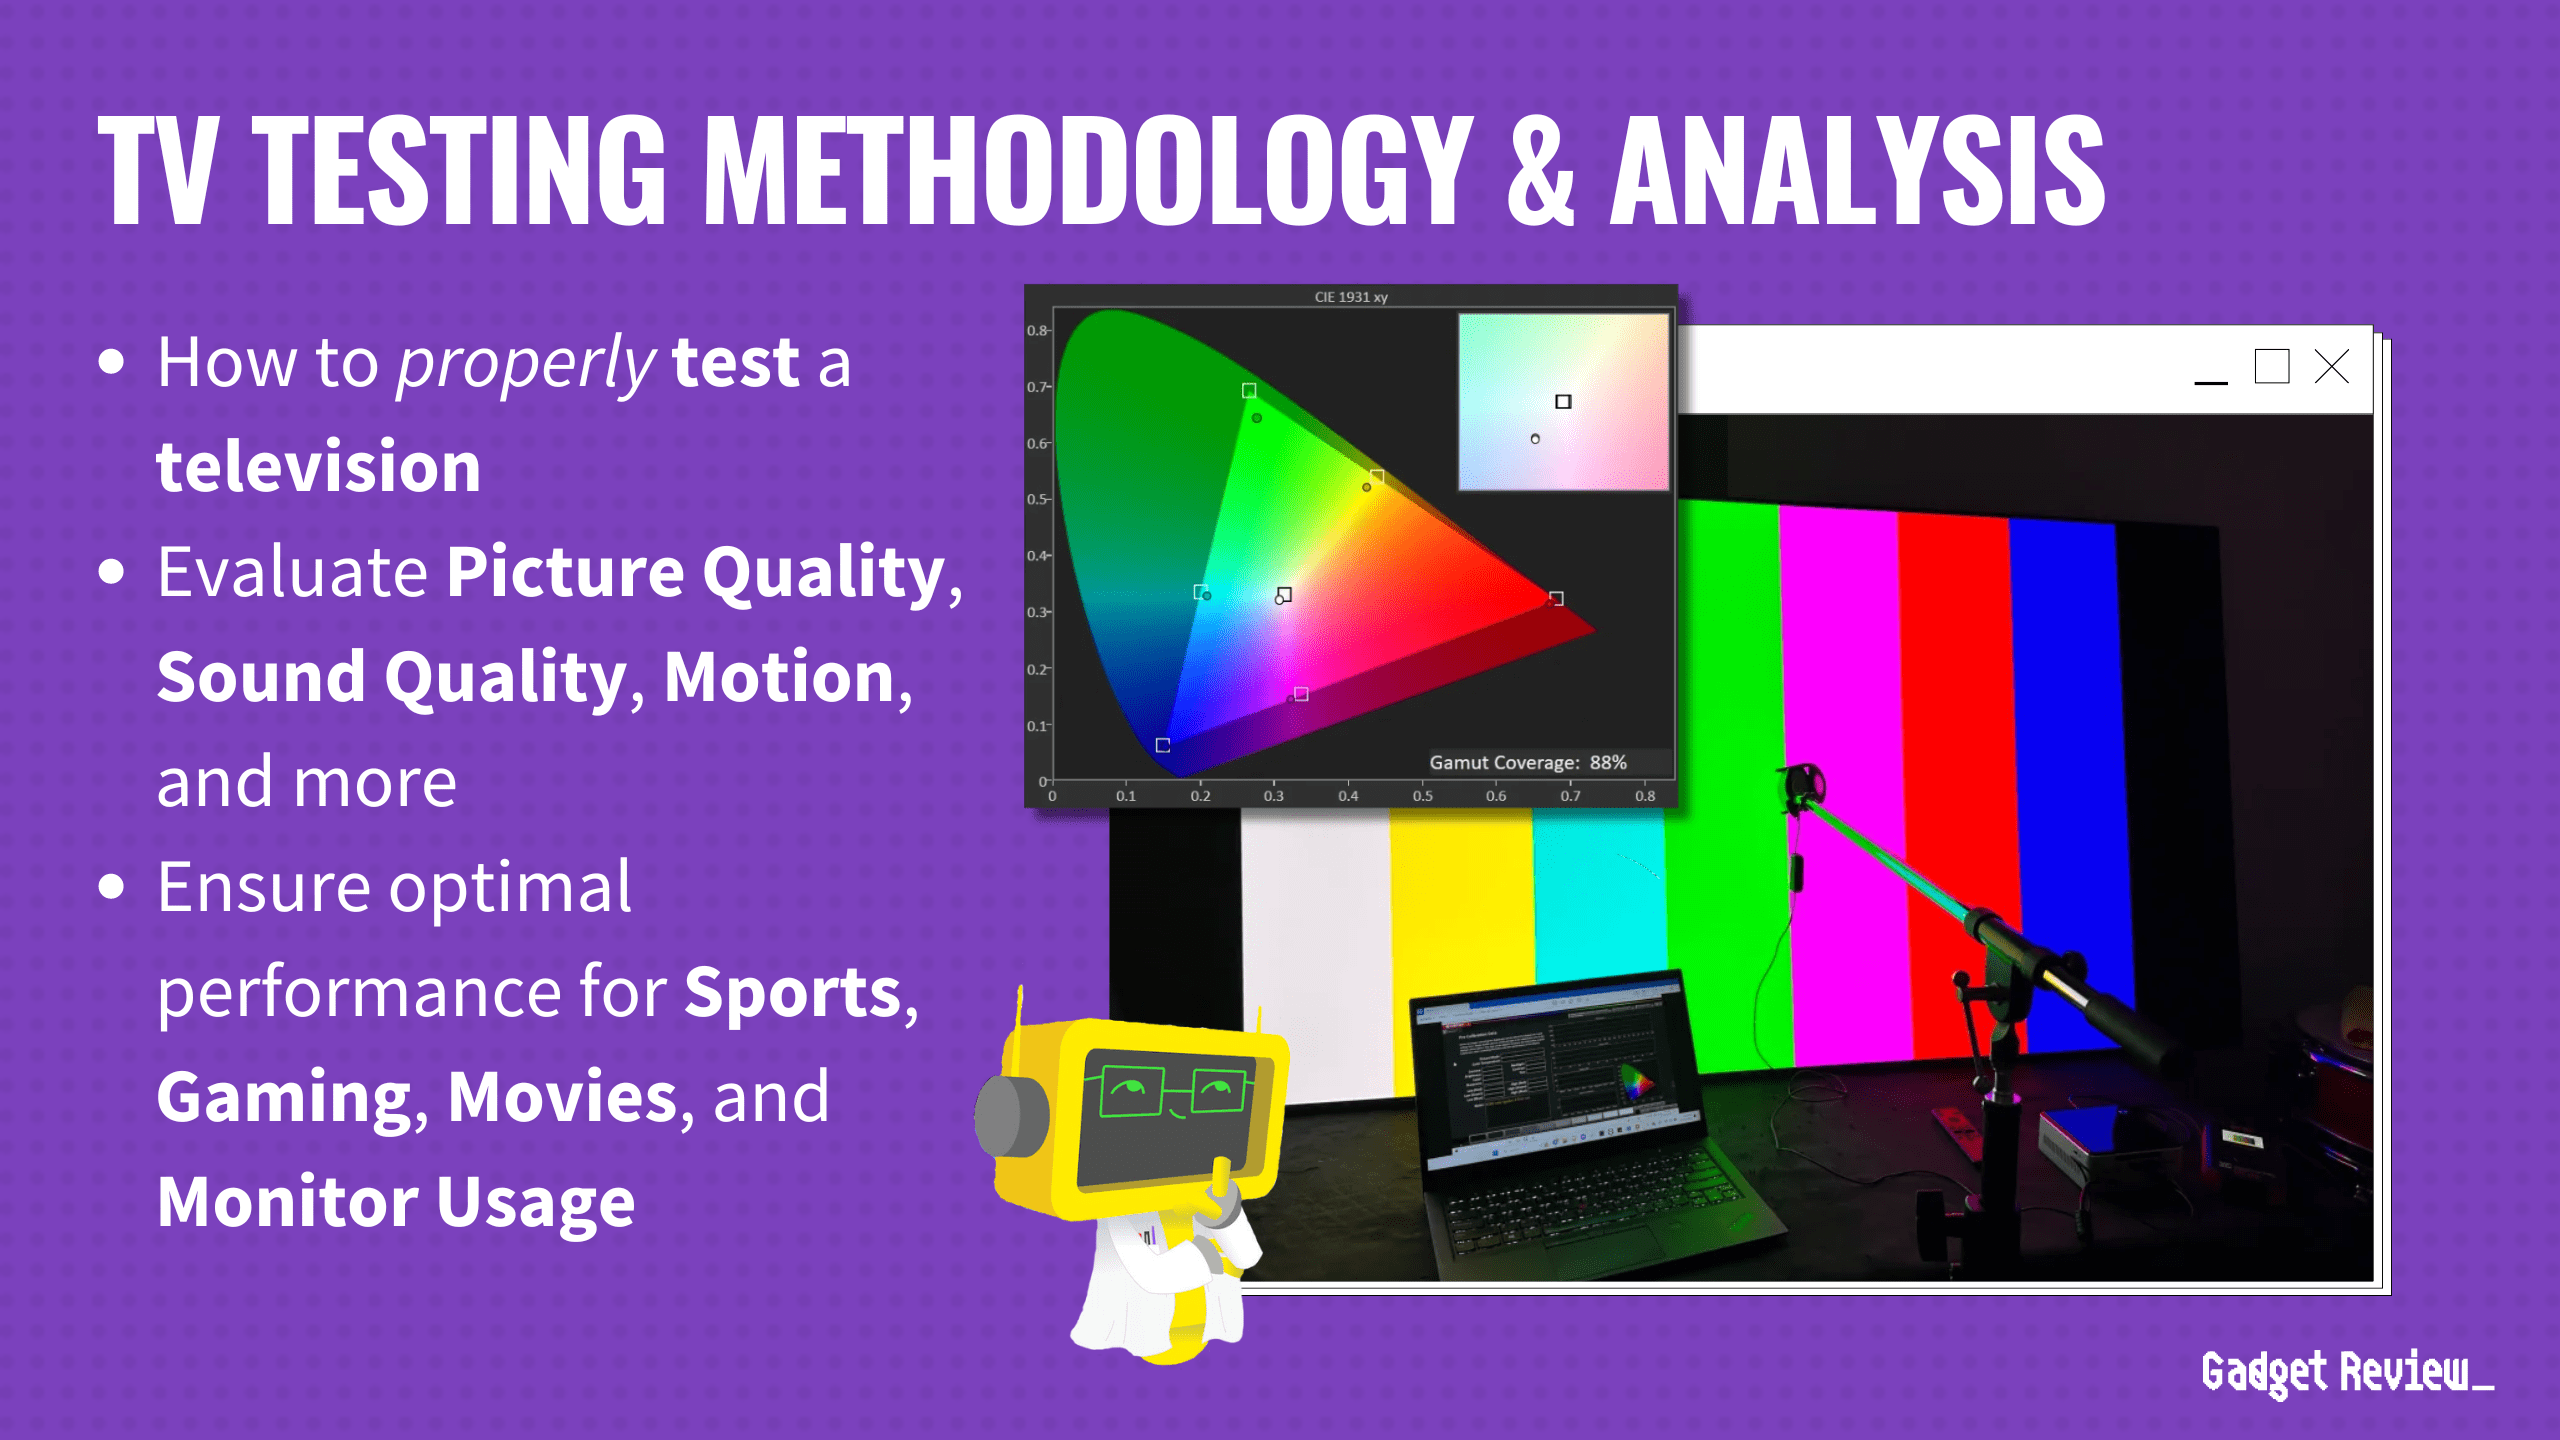
Televisions, a staple in consumer electronics since the late 1920s, embody a rich history of technological evolution. As they have evolved into more sophisticated and complex devices, so too have our methods and tools for evaluating them. This complexity transcends the mere ability to install and watch a new television set; it requires a deep dive into the intricate world of industry-specific standards, the deployment of specialized measurement equipment, and a rigorous process of quantifying data.
At Gadget Review, we don’t just test televisions; we apply a meticulous, quantitative approach to ensure they meet the high-quality, durability, functionality, and value standards our consumers have come to expect. This commitment to excellence and thorough evaluation is a reflection of our brand ethos, emphasizing our dedication to offering products that not only meet but exceed our customers’ expectations in every aspect. It’s this philosophy, detailed in our ‘About Us’ section, that guides our mission to bring you technology that enriches your life, backed by comprehensive insights and an unwavering commitment to value.

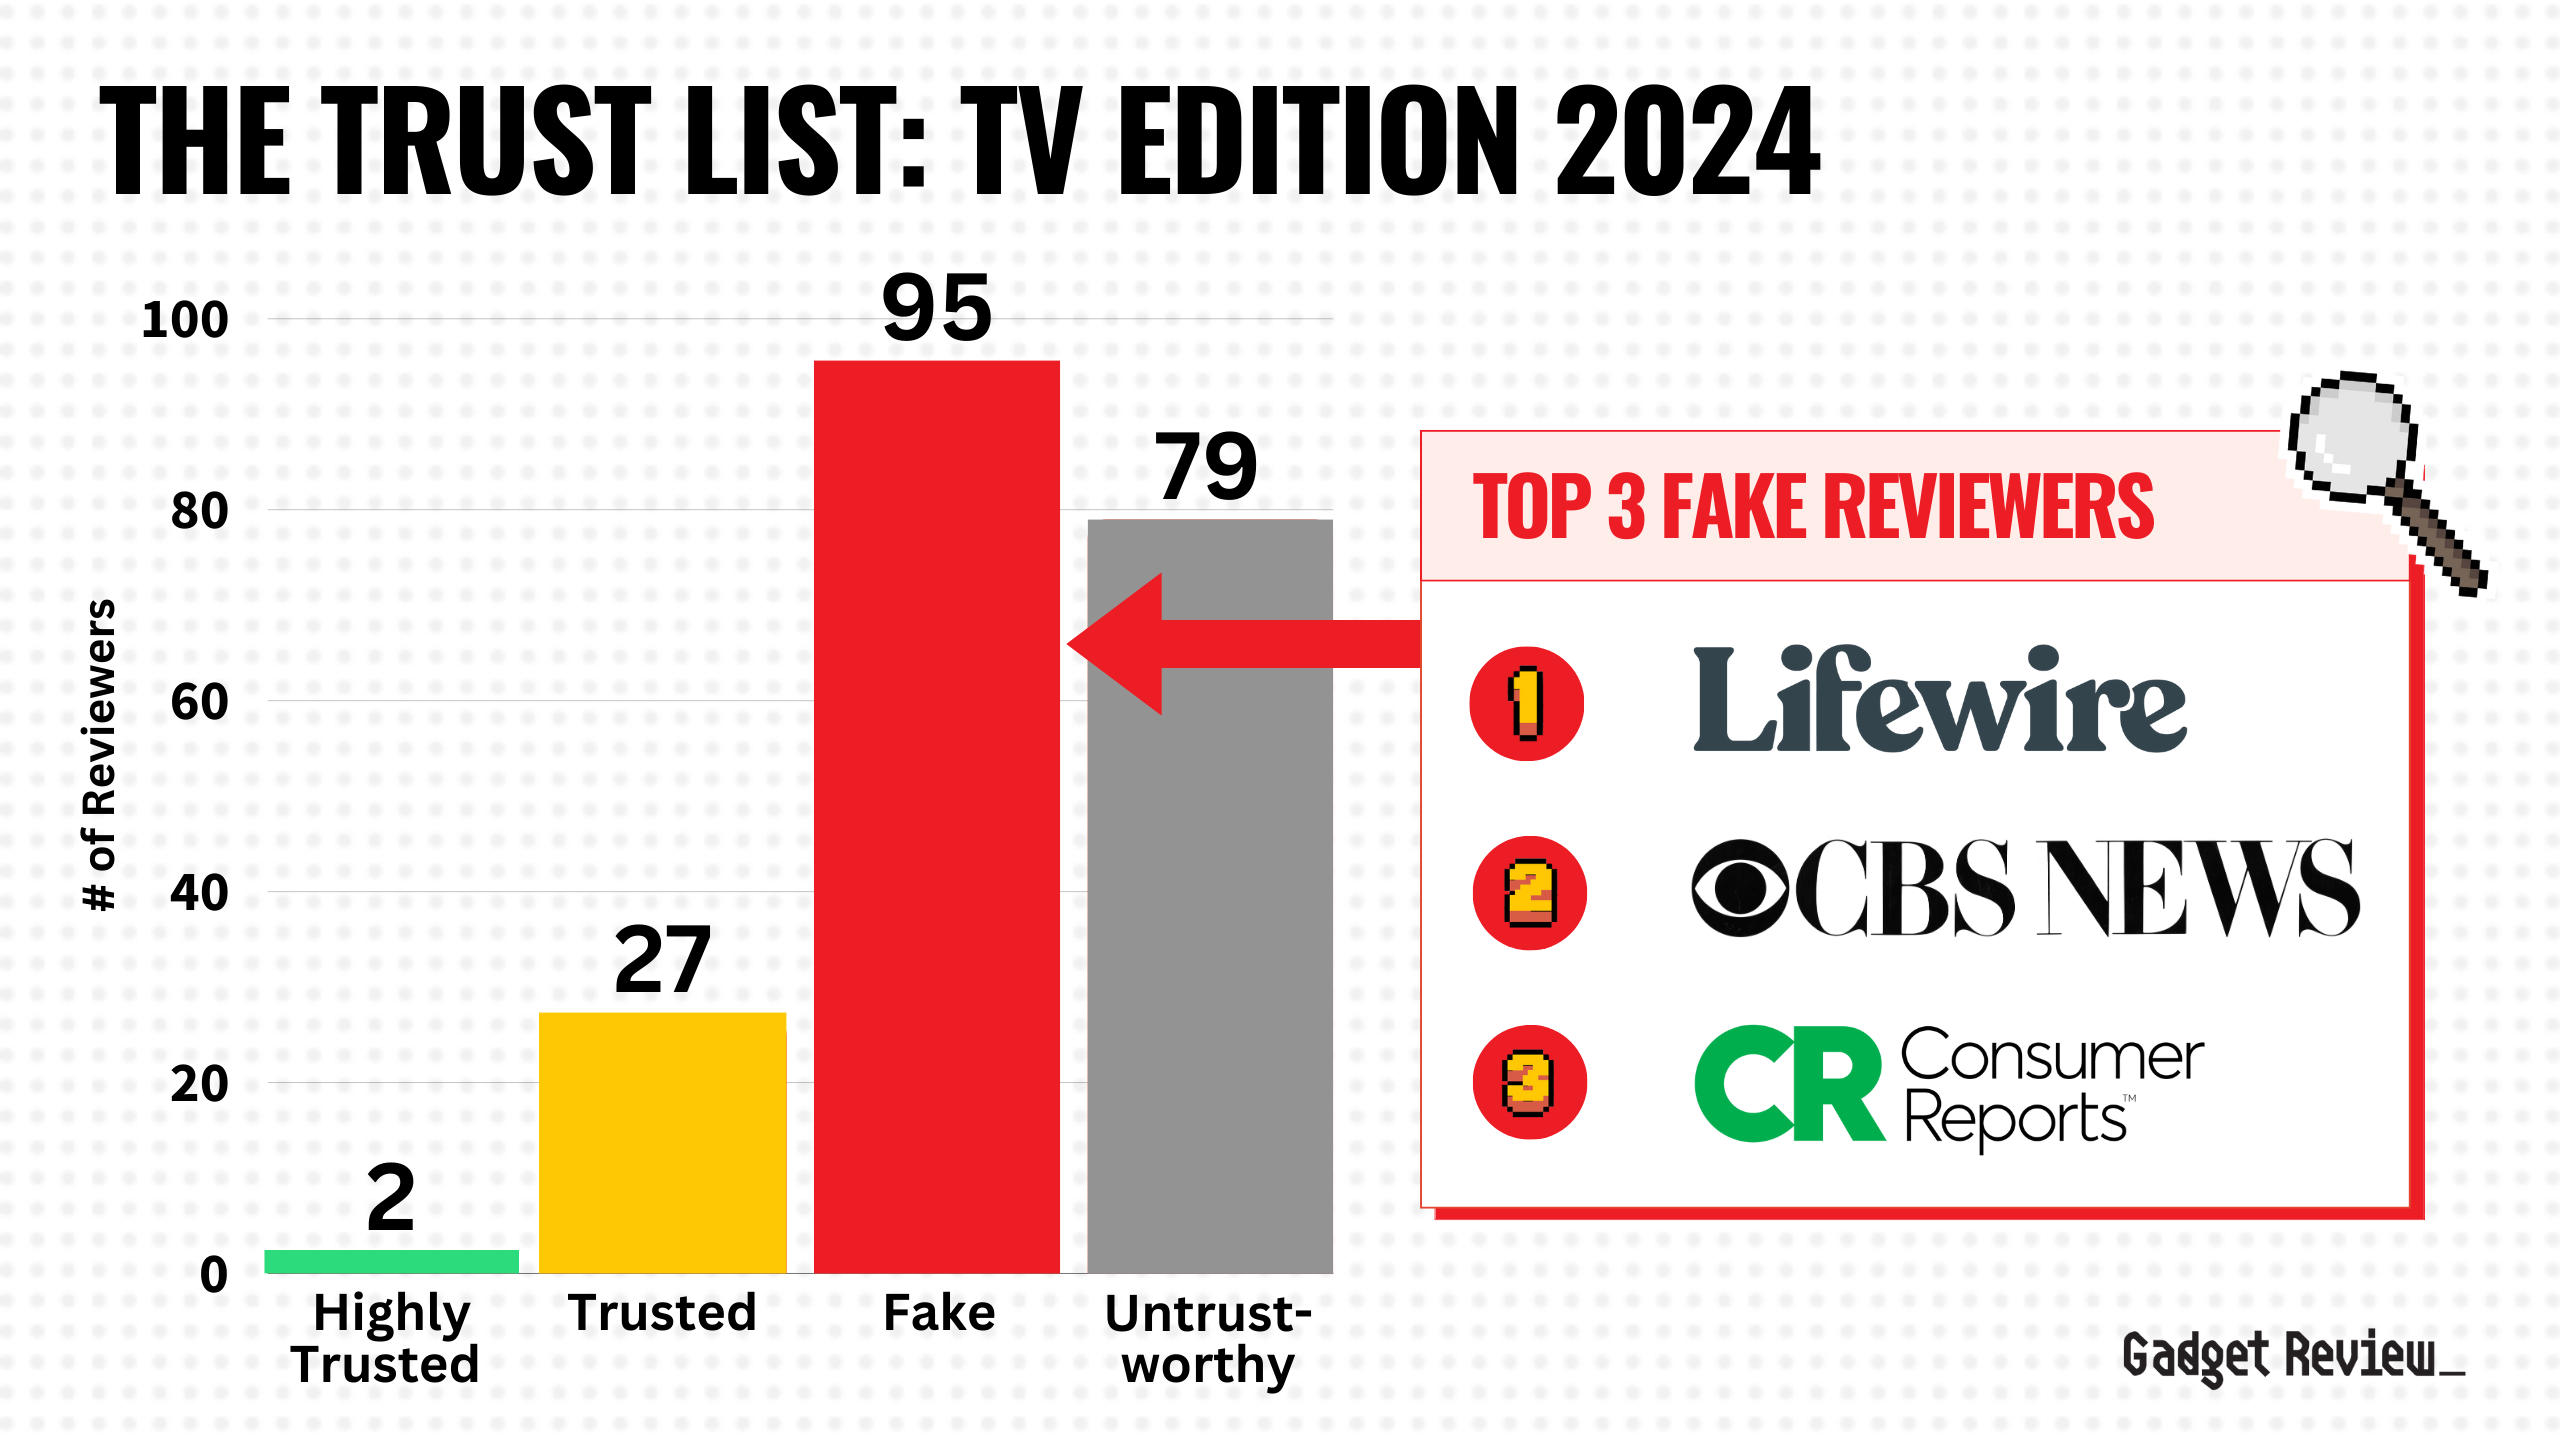
DID YOU KNOW 87% OF TV REVIEWERS ARE UNTRUSTWORTHY?
Our extensive analysis of 210 television reviewers has unveiled a concerning trend: a mere 22% of publications conduct actual tests on the televisions they review. Even among these purportedly verified testers, the average Trust Rating is disappointingly low, highlighting a failure to meet the expected standards of reliability and integrity.
The root of this issue lies in the lack of comprehensive quantitative testing across the industry. Instead of conducting in-depth evaluations, the majority of reviews are only scratching the surface, relying on qualitative assessments. Alarmingly, our findings indicate that approximately one in four (24.5%) television reviews appearing on the first page of search results are, in fact, fake—lacking any real test results or evidence of hands-on testing.
Frequently, these reviews resort to merely paraphrasing information that could be easily gleaned from customer feedback or manufacturer spec sheets, rather than offering insights from genuine product analysis.

TV Reviews Analyzed

158
Total Products Analyzed
The Consequences of Not Addressing Fake Reviews__
Failing to address the proliferation of fake reviews not only misleads consumers but also undermines the credibility of the entire review ecosystem. Consumers deprived of trustworthy information may end up making poorly informed purchasing decisions, leading to dissatisfaction and eroding trust in review platforms and products alike.
Proposing a Solution
To combat this issue and restore confidence in product reviews, a robust solution is necessary. [Your Brand] commits to setting a new standard by:
- Implementing rigorous, quantitative testing methodologies for all reviewed televisions.
- Enhancing transparency about our testing processes, ensuring consumers understand the depth and breadth of our evaluations.
- Actively working to distinguish our reviews from those lacking verifiable testing, providing a beacon of reliability for consumers navigating through a sea of misinformation.
By addressing the problem of fake reviews head-on and offering a clear, actionable solution, we aim to lead by example, encouraging other publications to follow suit and contribute to a more honest and reliable review culture.
What Part Is Quantitative And Qualitative?
Quantitative tests feature results that are measurable and repeatable with reference test patterns. Common quantitative tests with televisions include:
- Luminance (nits/cd/m2)
- Contrast ratio (dynamic range)
- Pixel response time(ms)
- Input lag(ms)
- Refresh rate(Hz)
- Resolution(pixel HxW)
- Gradient (bit depth)
- Viewing angles (contrast loss)
- Color gamut (%coverage)
- Reflections(nits reflected)
- Judder(refresh Hz)
- Image retention(seconds).
Qualitative tests, on the other hand, are based on things that can’t be properly measured or are a “feeling” someone gets. These include tests that check for build quality, visual black level (not measured), and visual color performance (not measured).
e.g. “Colors really pop.” “Stunning color.” “Deep blacks.” “Fluid Motion” vs. “92% P3 wide color gamut coverage.” “On/Off contrast ratio of 6,531:1.” “Pixel response time of 3ms.”
Testing Equipment Used_
This is the equipment that testers/experts used to ascertain the quality of a TV:
| Tools | Measures | Details | |
|---|---|---|---|
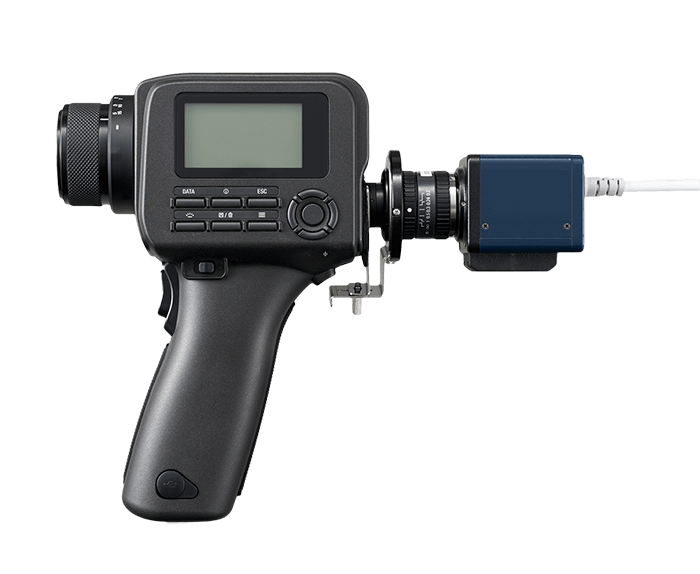 | Colorimeter; luminance meter; photo-spectrometer; photo-radiometer | Brightness; contrast; color gamut and accuracy | These tools are pointed at the display to measure luminance and color. |
 | Video input: game console; streaming device; Blu-Ray player; signal generator | Subjective image quality; software features and settings; real-scene brightness and contrast | Casual viewing from a game or movie is a great subjective test. |
 | Testing software: Calibration software; diagnostic programs; specialized video files | Color gamut and accuracy; response time; various visual artifacts | A large amount of software, capable of analyzing an extensive array of data types, is available either online or as part of hardware packages |
 | Input lag tester; High-speed video camera | Input lag | While these tools are often custom made or approximated with video footage, dedicated hardware for the purpose is available these days. |
TV Categories of Performance & Performance Criteria_
To assess how high or low quality a TV actually is, one must evaluate its performance, which refers to the product’s ability to deliver optimal results and meet or exceed expectations in terms of its intended functionality, efficiency, and effectiveness.
There’s no one thing that makes a particular TV or product good too. It’s a combination of several different factors called Performance Criteria, and each has a unique impact on a given product’s performance. Multiple Performance Criteria make up a single Category of Performance.
Here are their definitions:
- Category of Performance – An encapsulation of related Performance Criteria to evaluate the overall performance of a product in a certain category. The right criteria must be selected to properly assess a Category of Performance.
- Performance Criteria – An individual standard, measurement, or benchmark used to evaluate and assess the performance of a product for a specific use or purpose.
The table below helps explain the Performance Criteria of televisions along with their units of measurement and why they’re important to test. Each of them is grouped into their own Categories of Performance, which we’ll define:
TV Categories of Performance
- Picture Quality – A broad term encompassing a variety of factors, all of which contribute to how good the display of a TV looks.
- Sound Quality – A broad term that covers all aspects of how moving objects look on a TV.
- Motion – Covers everything related to how well a television is capable of handling motion on screen without a loss of detail.
- Inputs – A broad term that covers everything related to people and devices interfacing with the television, from its ability to respond to input to the inputs it can accept.
- Design – Covers everything related to the actual physical design of the television, from size and weight to reflectivity of the screen.
Picture Quality
A broad term encompassing a variety of factors, all of which contribute to how good the display of a TV looks.
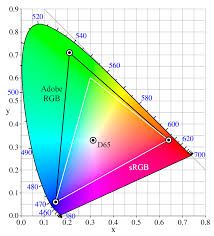
A. Color Gamut
This particular criterion measures how many different colors can be displayed by the set. Multiple color gamuts exist, each with their own range of possible colors, and a television may not accurately and fully cover one of them despite completely covering another.
- Unit of Measurement: Color Gamut is measured with color space coverage, expressed as a %.
- Testing Equipment: A colorimeter
- Why It’s Important: Too many inaccurate colors can be distracting while you watch TV. If you want a TV with stellar picture quality, you need to get one that can display many different colors and can consistently display multiple colors no matter the brightness.
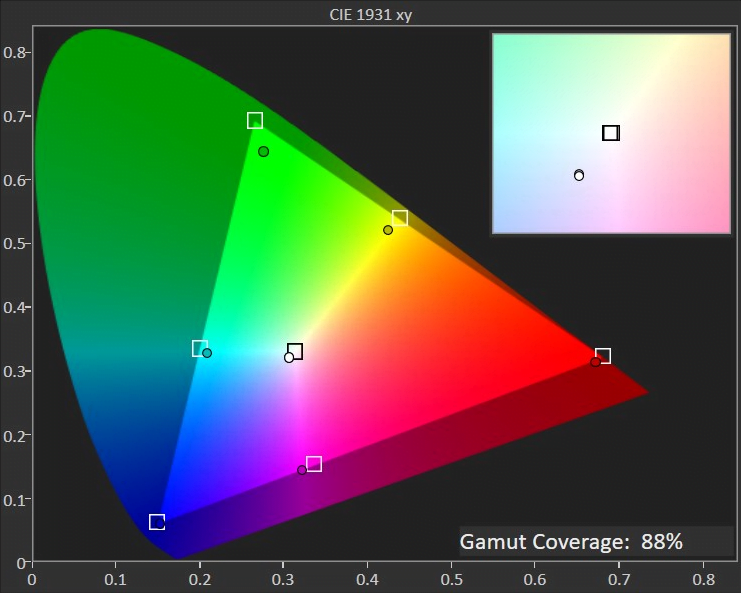
Example image of a color gamut graph. | Evan Shepard/Gadget Review
- SDR Brightness – How bright the TV can get when displaying SDR (standard dynamic range) content.
- Unit of Measurement
- Nits (or cd/m²) at specified certain pattern size (commonly 10% window)
- Testing Equipment
- Spectrometer or colorimeter
- Why It’s Important
- This can help you watch content in a bright room without the colors getting washed out by the glare.
- Unit of Measurement
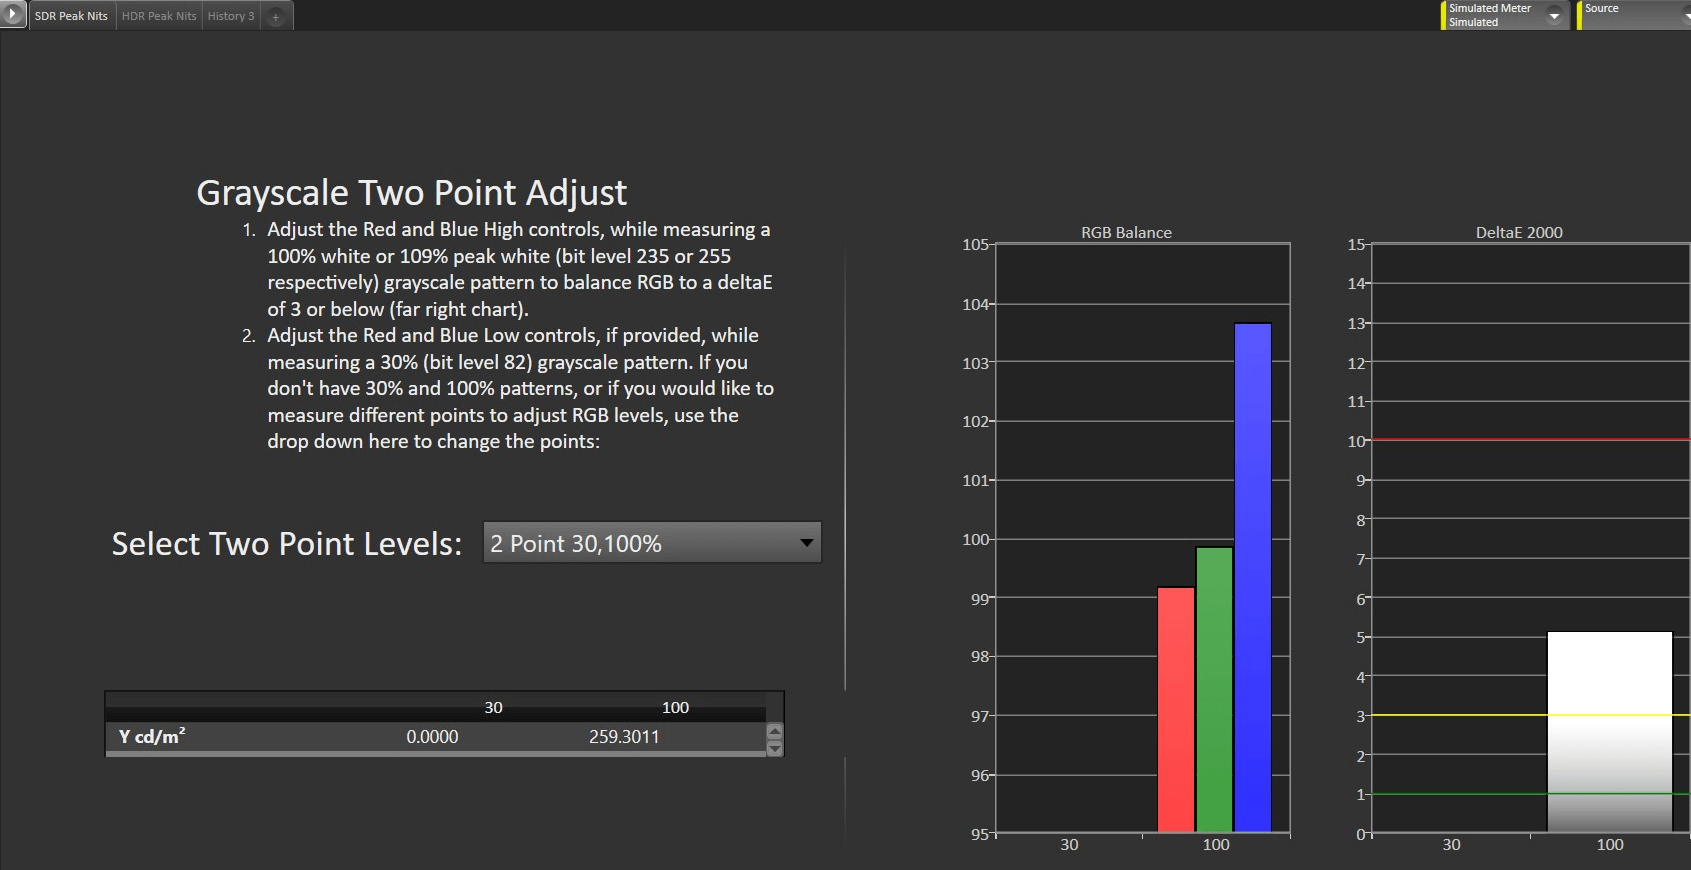
Peak SDR Nits Measurements | Evan Shepard/Gadget Review
- HDR Brightness – How bright the TV can get when displaying HDR (high dynamic range) content.
- Unit of Measurement
- Nits (or cd/m²) at specified certain pattern size (commonly 10% window)
- Testing Equipment
- Spectrometer or colorimeter
- Why It’s Important
- If your TV supports HDR, you can enjoy HDR content on it, and the HDR brightness levels will directly impact how dynamic the image itself looks.
- Unit of Measurement
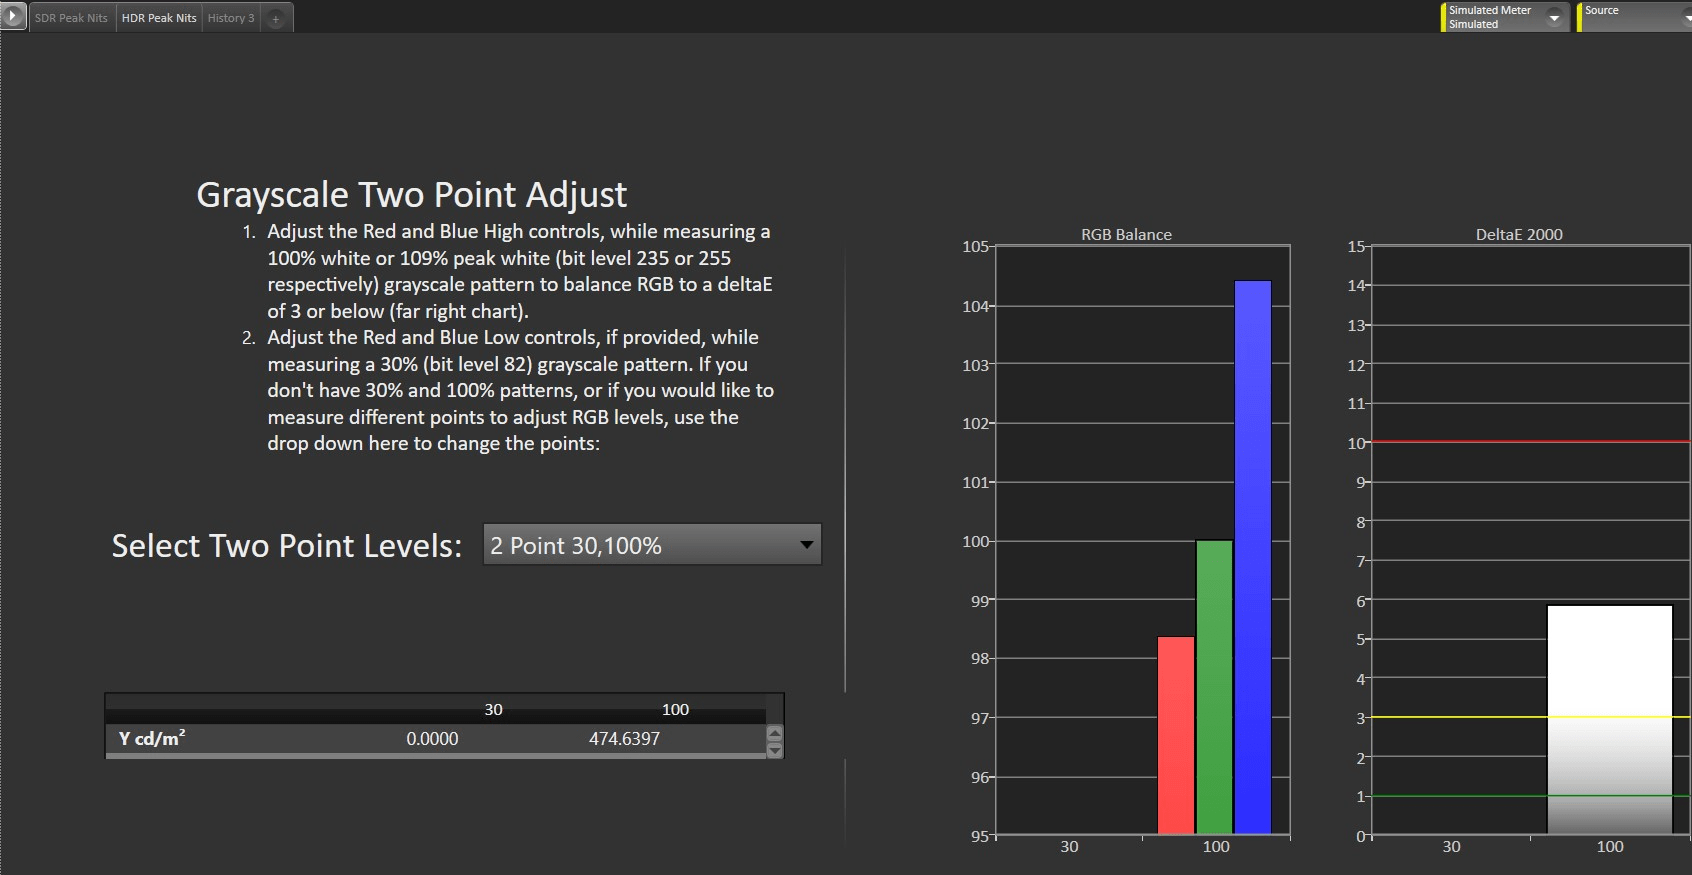
Peak HDR Nits Measurements | Evan Shepard/Gadget Review
- Reflections – This criterion measures how much light the TV reflects off its screen when subjected to light.
- Unit of Measurement:
- Percent of light reflected (%)
- Testing Equipment:
- Spectrometer, Sampling Sphere
- Why It’s Important: This can help you watch content in a bright room without the colors getting washed out by the glare.
- Unit of Measurement:

Reflections Testing Example Image, RTings
- Contrast Ratio – The ratio between the brightest white and darkest black that the screen can display.
- Unit of Measurement
- Normally presented as a whole number ratio (4,020:1)
- For testing, Luminance (cd/m2) is measured.
- Testing Equipment
- Luminance meter
- Why It’s Important
- A higher contrast ratio results in deeper blacks that can let you see more definition in the content–which is helpful in darker rooms.
- Unit of Measurement
- Viewing Angle – This defines the angle at which your TV’s picture starts to appear distorted. Wider viewing angles are better, so you have more viewing positions to watch the most optimal screen.
- Unit of Measurement
- Degrees (°)
- Testing Equipment
- Colorimeter
- Why It’s Important
- If multiple people will be watching your TV at once, a wide viewing angle will help avoid someone being stuck watching a distorted screen.
- Unit of Measurement
- EOTF – How your TV interprets and renders the luminance data from content and translates it to be represented on screen. If EOTF/Gamma tracking is too low or too high, it will result in an over-brightened or over-darkened image from reference.
- Unit of Measurement
- This test measures for the delta between the TV output and a standard line, but has no actual specific unit of measurement
- Testing Equipment
- Colorimeter
- Why It’s Important
- EOTF ensures that the game is displayed (color and HDR brightness) as the creator intended it.
- Unit of Measurement
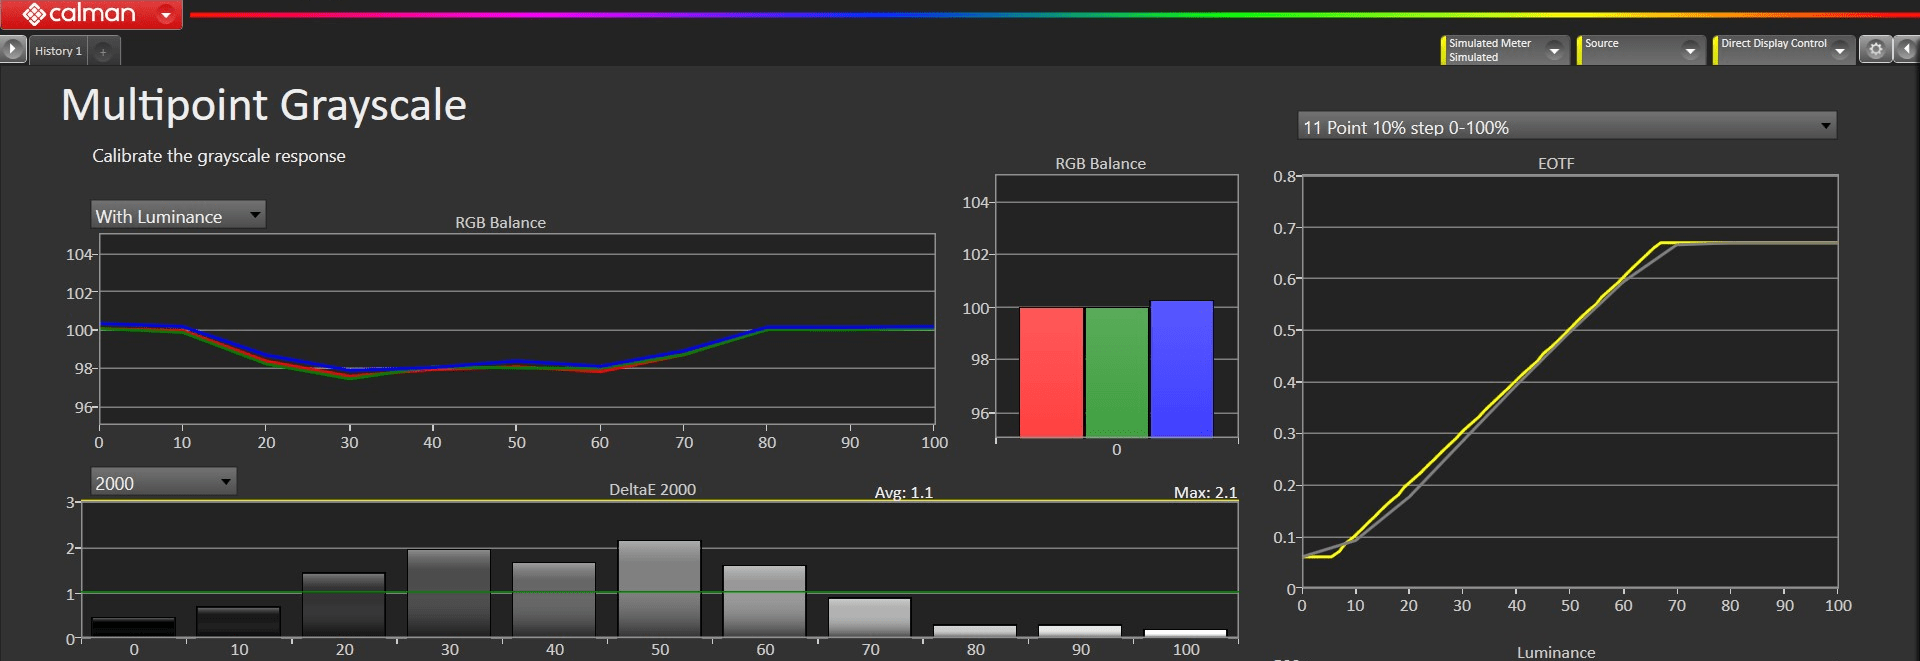
EOTF Measurements | Evan Shepard/Gadget Review
2. Motion – Covers everything related to how well a television is capable of handling motion on screen without a loss of detail.
- Response Time – This stat measure shows how fast it takes a pixel to change from one color to another and is commonly in the 8ms to 14ms range.
- Unit of Measurement
- Milliseconds (ms)
- Testing Equipment
- USB tool (records how fast the TV can transition between shades of gray)
- Why It’s Important
- Ideally, you want your response time to be lower, especially if you’re going to be gaming or watching sports to help cut down on motion blurring. Look for TVs with response times that are 6ms to 10ms, but going even lower is good!
- Unit of Measurement
3. Sound Quality – A broad term that covers all aspects of how moving objects look on a TV.
- Frequency Response – This test measures how accurate the sound level of each frequency made by the TV is.
- Unit of Measurement
- Decibels (dB)
- Testing Equipment
- Microphone, SPL Meter, Audio Interface
- Why It’s Important
- You get a more balanced and neutral sound out of your TV.
- Unit of Measurement
- Distortion – It involves the input signal sounding different from the output that you hear coming out of the TV.
- Unit of Measurement
- Total Harmonic Distortion (%)
- Testing Equipment
- Microphone, Audio Interface, SPL Meter
- Why It’s Important
- You get a clean sound that aligns with how the original content was intended to be consumed.
- Unit of Measurement
4. Connectivity – A broad term that covers everything related to people and devices interfacing with the television, from its ability to respond to input to the inputs it can accept.
- Input Lag – This measures the delay between the input action and the on-screen reaction or effect.
- Unit of Measurement
- Milliseconds (ms)
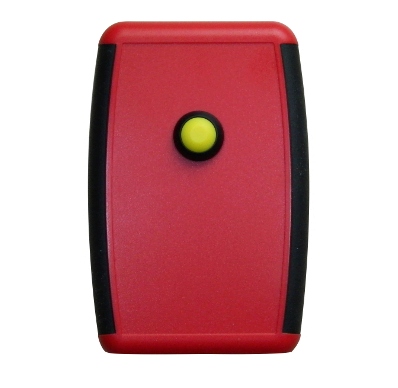
- Testing Equipment
- Leo Bodnar tool, HDFury Integral, HDFury Linker device
- Why It’s Important:
- A higher input lag can hinder your timing and the TV’s performance so aim for a TV with little to no input lag.
- Unit of Measurement
5. Design – Covers everything related to the actual physical design of the television, from size and weight to reflectivity of the screen.
- Special Note – Design, being a largely subjective category of performance, is very difficult to properly test. While you can drop items and test them for scratch resistance, these are rarely useful tests in a practical sense for items as large as televisions.
How often should Tests be updated?
TV testing only really has to change as technology changes or updates. Better equipment or new equipment may create new tests, much like new TV tech will require new tests to score it.
Quantifiable Performance Criteria Based On Usage__
The most common use cases for televisions are listed below, along with explanations for how testing is used to assess the most important performance criteria that are associated with those use cases.
Some use cases have overlapping performance criteria, but to help avoid redundancy, we’ve avoided including repeated explanations of the criteria under each section.
Which TV is best for you, though, depends on what you’ll be using it for. Some common consumer profiles we’ve noted are laid out below.

The Sports Fan
- Pain Points: Many reflections, low brightness, slow response time, and bad viewing angles.
- Crucial Performance Criteria:
- Reflections: You’re probably going to watch some games during the day, so you may face wanting to watch TV with strong light sources spilling into your space. Make sure your TV of choice doesn’t reflect too much light, otherwise you’ll be distracted from the game.
- Brightness: A TV with good brightness will improve the visibility of the game on screen while you watch in the middle of the day.
- Response Time: Slow response times result in motion blur, which reflects poorly on fast-paced objects on screen. If you’re a sports fan, a good response time will make a fast-paced game appear sharper.
- Viewing Angle: A wider viewing angle will make your game watch parties more enjoyable for everyone sitting around your TV. That way, no one is stuck watching a distorted view of the game. Plus you get more sitting position choices, so you can comfortably watch games around your space.

The Avid Gamer
- Pain Points: Low brightness, lack of inputs, bad black levels, bad response time, low contrast, input lag.
- Crucial Performance Criteria:
- Input Lag: Gamers that play fast-paced games should aim for a TV with low input lag so that your TV responds efficiently to the signals that your controller is sending it. Otherwise your gameplay can be negatively affected.
- Response Time: Fast response times will minimize annoying motion blur during fast-paced video games.
- Contrast: If you tend to game in a dark room, good contrast levels will improve the picture quality of the game. Or if you experience dark scenes during gameplay, a good contrast ratio that can display deeper blacks will help you see all the dark elements on the screen.

The Movie Buff
- Pain Points: Lack of inputs, bad black levels, low contrast, blooming.
- Crucial Performance Criteria:
- Contrast: When you’re watching dark scenes, you want to be able to see all of the elements on the screen clearly. Good contrast ratio helps define those elements while being capable of displaying deeper blacks.
- Local Dimming: This feature helps you watch dark scenes more easily by having the TV automatically dim backlight zones to deepen the black levels. But make sure that the local dimming doesn’t cause excessive blooming around the lighter objects in the scene.
- Black Uniformity: This refers to how even the black level of the dark elements on the screen appear to be. This helps a movie watcher be able to watch dark scenes in a dark room.
The Monitor User
- Pain Points: Bad viewing angles, input lag, bad response time.
- Crucial Performance Criteria:
- Viewing Angle: If you plan to use the TV as a monitor, you’ll probably be sitting closer to the screen. Wider viewing angles will help the edges of the screen look even with the center and not distract you while you use your TV monitor.
- Input Lag: You’ll probably be using a keyboard and mouse to use the TV monitor. You want to make sure the input lag is low so there aren’t any delays while you click and type–this will keep you more efficient.
- Response Time: A monitor user will be navigating around various webpages, so look for a TV with a low response time so you don’t notice any motion blur while scrolling through pages quickly or watching a video online.
Publication Analysis_
See how we develop our Trust Rating and which publications earn high ranks vs. the “dirty dozen.” These are publications who claim to test, but produce no quantifiable test results.
The Trust List: TV Review Edition 2023
Total Websites Analysis
| Category | Number of Sites | Percentage |
|---|---|---|
| Total Sites Analyzed | 210 | 100% |
| Trustworthy Testers* | 24 | 11.43% |
| Fake Testers† | 115 | 54.76% |
| Untrustworthy Reviewers‡ | 71 | 33.80% |
* A reviewer who says they test and earned a Trust Rating of at least 60%
† A reviewer who says they test but they earned a failing Trust Rating under 60%
‡ A reviewer who doesn’t say they test but they earned a failing Trust Rating under 60%
Top 3 Testers_
- RTings – 101.40% Trust Rating
- PCMag – 91.40% Trust Rating
- CNET – 89.00% Trust Rating
The Best Tests Amongst The Testers_
Best Photo Tests
RTINGS (Every product; Example Here)
Best Test Charts & Graphs
RTINGS (Every product; Example Here)
Best Video Tests
- PC Mag – How We Test Everything We Review
- Consumer Reports – How We Pick Top TVs: Inside CR’s Labs
- RTINGS– Motion on TVs: Response time (3/5) – Rtings.com – YouTube
Best Expert Testers
- Matthew Lopes – RTings Profile, MuckRack, no Twitter
- Will Greenwald – PCMag Profile, MuckRack, Twitter
- David Katzmaier – CNET Profile, MuckRack, Twitter
Best Video Reviewers
- Phil Hinton [AV Forums] | TV Trust Rating: 84.5%
- Nicholas Di Giovanni [RTings] | TV Trust Rating: 78%
- Caleb Denison [Digital Trends] | TV Trust Rating: 72%
Category Specific Custom Questions_
We ask a series of questions to help us determine how truthful a publication really is when they claim to test. These are questions designed to cut to the core of what a consumer looks for in a product that guarantee that a product was not only used by a publication, but also properly tested to provide meaningful data and insights that a consumer can use to make a purchase decision. For this category, our custom questions were:
- Does the publication run quantitative tests for brightness? (nits or cd/m²)
- Brightness simply measures how much light a display outputs. It’s important in a display for vivid images as well as improving visibility in bright environments, such as a living room with a window that lets lots of natural light in.
- Nits and cd/m² are completely equivalent measurements and are thus interchangeable.
- Does the publication run quantitative tests for contrast? (as ratio, x:y)
- Contrast measures the ratio of the TV’s brightest highlights against its darkest blacks, as a ratio of the measured luminance values (nits/cd/m²) of each. It’s primarily a factor of image quality, resulting in a crisper image and more vivid colors.
- OLED displays throw an interesting wrench into contrast measurement because, being that OLED pixels are self-emissive and are totally off when displaying true black, the effective contrast ratio of a true OLED display will always be Infinite:1.
- Does the publication run quantitative tests for color gamut? (as a percentage)
- Color gamut is the quantitative measurement of the range of colors a display can produce, measured against an industry-standard reference known as a color space.. It is most important for general image quality; the use cases that actually care about color accuracy, such as graphics work, are usually applied to computer monitors instead.
- Does the publication run quantitative tests for input lag? (ms)
- Input lag refers to the time it takes for a display to change the on-screen image in response to user input, such as from a game controller or TV remote. It is generally only important for gaming and is sometimes skipped over as a result.
Without a game console connected, input lag is only noticeable from your remote, which is generally expected to be a little clunky and slow to begin with as a result of the technology that powers it.
- Input lag refers to the time it takes for a display to change the on-screen image in response to user input, such as from a game controller or TV remote. It is generally only important for gaming and is sometimes skipped over as a result.
Maturity of Tests – Top 10 Testers_
Analysis of the Top Testers: Despite the material that top testers present on how they test televisions (from videos, to pictures, to charts and graphs) they still leave a lot to be desired when it comes to scoring.
RTINGS and Consumer Reports feature breakdowns of the scores given to a television (RTINGS is especially exhaustive). The rest (the non-paywalled ones, anyway) tend to simplify to a basic score system – be it 5 stars, out of fives, out of tens, or out of hundreds. Some of them don’t even use scoring systems, which is even worse.
For in-depth analysis of the top 10 testers for TVs, see our TV Trust List.
Big Names That Didn’t Make It_
- Techradar – Trust Rating: 56.60% – An example of a publication that’s almost passing but just misses the mark from a lack of testing on key features; namely, input lag, color gamut and contrast ratio testing. They mention input lag and contrast but doesn’t provide testing evidence or measurements for either of them, which holds them back.
Their simple scoring system, which works out of five stars, also reduces their granularity and clarity in scoring. They certainly test, given the quantitative measurements they do provide, but they’ve got ground to cover still. - Lifewire – Trust Rating: 48.40% – Although it’s clear that Lifewire does actually use the products, their current methods for approaching and documenting their testing leaves important measurements and examinations of key features on TV lacking. There’s plenty to go off of in their reviews that is qualitative in nature, but ultimately there’s very little that is quantitative. Their scoring system (out of five stars) is also lacking in granularity.
- Consumer Reports – Trust Rating: 35.40% – Full product reviews are not credited to an author. They have a scoring system that looks detailed but is ill-defined in reality with next to no accessible objective data to back it up. If they’re doing the testing they claim, they should have plenty of data to publish, but very little of it is provided.
Who Owns Who?_
In today’s rapid-fire world, it’s hard to keep track of who’s behind the wheel of any given website you visit. Unfortunately, many websites are owned by the same major company, which creates uncertainty when you’re trying to read product reviews and recommendations. If five sites are all owned by the same company and they all give the same product a glowing recommendation, is that because they believe that, or because they have to march in lockstep?
We dive into the publication Parent Companies’ average Trust Ratings in the TV Trust List.
Best 3 Testers’ Top Scoring Products Overlap_
| RTINGs | PC Mag | CNET |
|---|---|---|
| Samsung S95B Mixed Use – 9.1 Movies – 9.4 TV Shows – 8.7 Sports – 8.9 Video Games – 9.4 HDR Movies – 9.2 HDR Gaming – 9.3 PC Monitor – 9.2 | Samsung S95B OLED Overall 4.0/5 | Samsung S95B OLED Did not review. |
| Hisense U8H Mixed Use – 8.6 Movies – 8.7 TV Shows – 8.4 Sports – 8.4 Video Games – 8.9 HDR Movies – 8.7 HDR Gaming – 8.9 PC Monitor – 8.4 | Hisense U8H Overall 4.5/5 | Hisense U8H Overall 8.8/10 |
| TCL 6-Series Roku TV Mixed Use – 8.5 Movies – 8.7 TV Shows – 8.2 Sports – 8.1 Video Games – 8.8 HDR Movies – 8.6 HDR Gaming – 8.7 PC Monitor – 8.0 | TCL 6-Series Roku TV Overall 4.5/5 | TCL 6-Series Roku TV Overall 8.9/10 |
Changelog_
TV Testing Methodology Refreshed [3/22/2024]
We’ve refreshed the TV Testing Methodology to provide clearer, more concise information. The page layout has been rearranged so it’s easier to navigate throughout the sections. The introduction was rewritten to better introduce the world of TVs, how they’re tested, and Gadget Review’s mission to inform people and give them the truth about the huge issue of fake online TV reviews.
Final Trust Rating V16 Notes [5/19/2023]
A single publication was flipped from failing to passing on its FINAL TRUST RATING:
- Home Theater HiFi
- OLD Final Trust Rating: 58.77%
- NEW Final Trust Rating: 61.60%
Only 2 publications flipped from a failing to passing CATEGORY TRUST RATING:
- Which?
- Old Category Trust Rating: 57.69%
- New Category Trust Rating: 60.75%
- Reference Home Theater
- Old Category Trust Rating: 59.62%
- New Category Trust Rating: 62.00%
Otherwise, the only thing the new 100-point scoring system did was move publications up and down a couple percentage points.
- On average, a publication saw its Final Trust Rating change by ± 1.14%
- On average, a publication saw its Category Trust Rating change by ± 1.43%